•
19-minute read
•


If you want Google to successfully crawl and index your pages, then your website structure has to be simple and scalable. To make all your indexed pages rank well, you need to properly interlink them to spread PageRank. To spread PageRank accurately, you need to know what pages on your website are most powerful.
It may look like a lot of hard work, but it is actually simpler than you may expect. With the website Visualization feature of WebSite Auditor, you can easily visualize your website structure to detect any shortcomings, make the necessary edits, and recalculate your optimization scores depending on the edits you make.
Using this super handy Visualization feature, you can significantly grow your website's impressions and SERP clicks – just like one of our users did.
Let’s have a closer look at the Visualization feature and learn how to make your website perfect with its help. But first things first…
In addition to smooth crawling and successful indexing, a well-planned website structure will benefit:
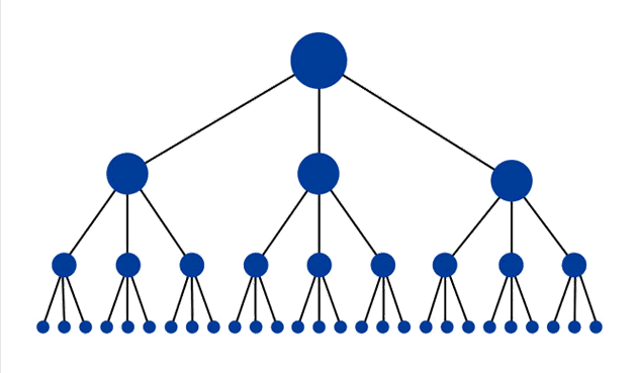
Let’s discover the dogma of simplicity and scalability in more detail. Key points for you to consider to build a good website structure are as follows:
Ok, done with theory. Let’s move to site structure visualization itself.
First off, you need to launch WebSite Auditor and create a project for your site or open an existing one if you have already used the tool. Then go to Site Structure > Visualization, and see what happens.
Once the tool visualizes your site structure, you can work in three modes:
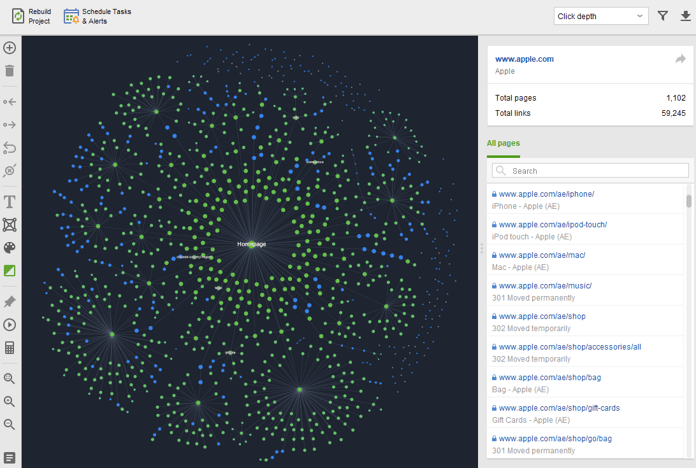
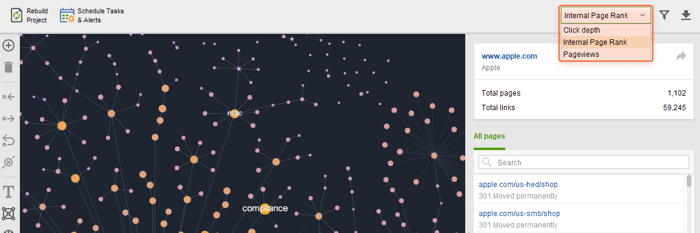
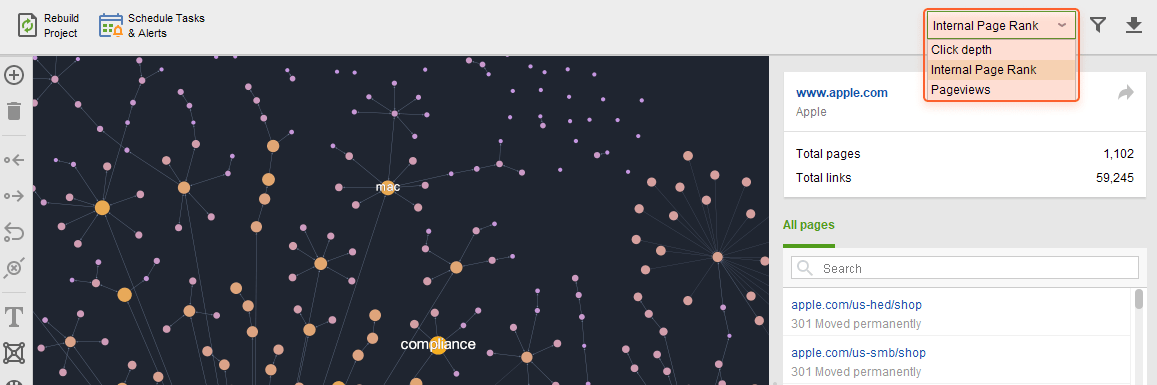
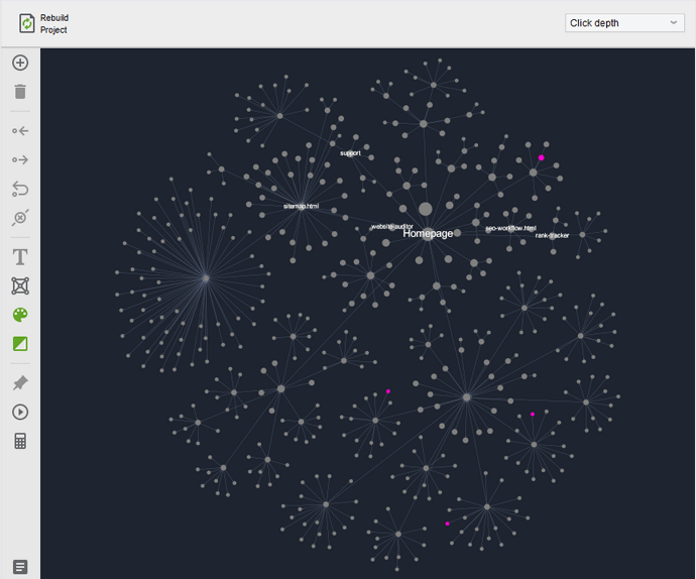
This is a default mode. WebSite Auditor shows 1,000 pages (this number can be adjusted up to 10,000 pages) that are arranged by Click Depth.
What pages are shown? The algo chooses the shortest connections between your top pages based on the lowest Click Depth values and the highest Internal Page Rank values.
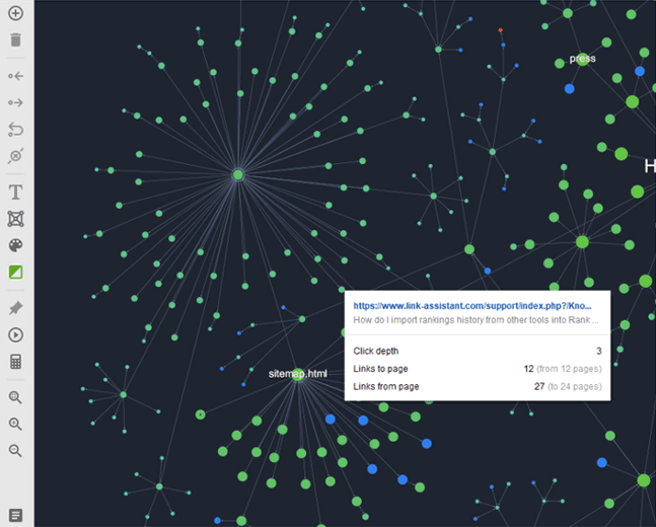
All the connections between nodes are shown as lines that represent the exact state of relations between pages. You can also drag any node to any place on the graph to visualize a better picture, as well as zoom the graph in and out.
In the column on your right, you can see the short statistics on the total number of your pages and links as well as the list of all the pages' URLs that can be found on your website. When you click any URL in the statistics list, it is then highlighted on the graph.
To go to this mode, click on any node on the graph. The tool will show all the connections the page has:
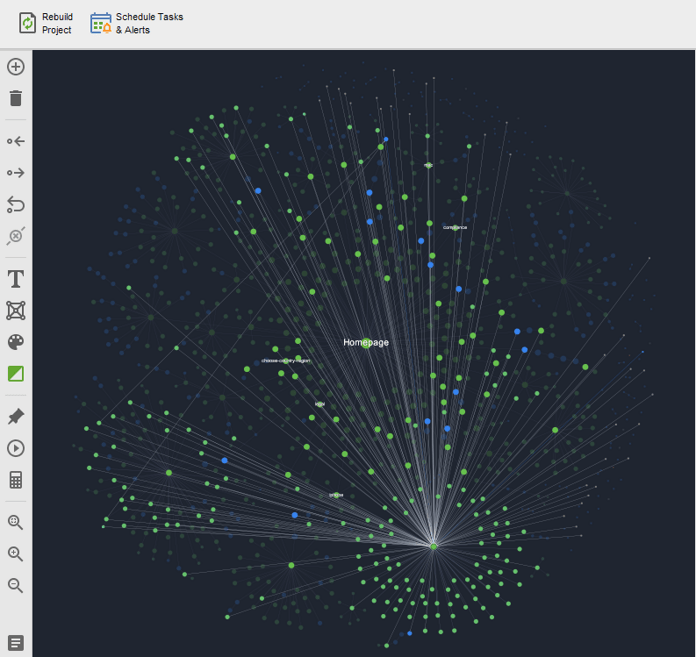
To return to the display of all connections, just click on any empty spot on the field.
To display all the existing connections between your pages, click on the Display all pages' connections button.
Keep in mind that the whole navigation of your site will be included in this graph, so if you do it for a large part of your site, it may look scary and confusing.
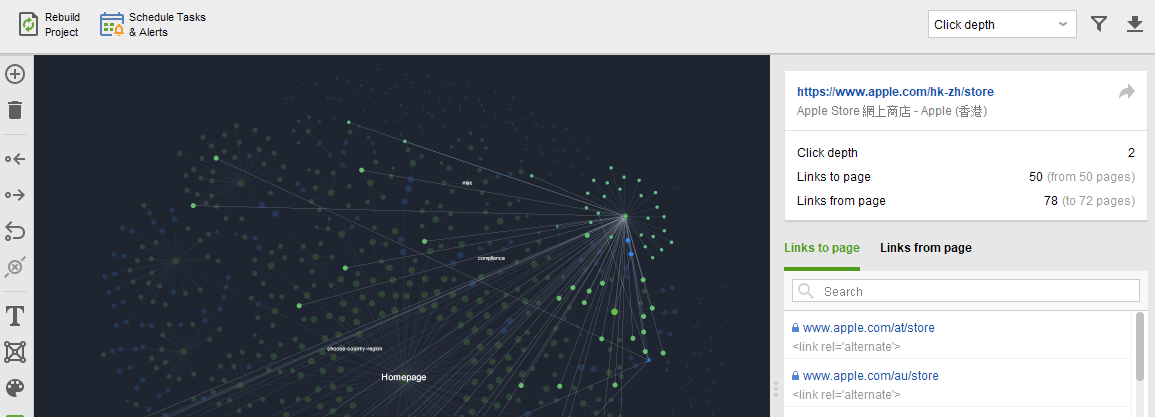
Check the click depth of any node by just clicking on it. The tool will show the information you need in the workspace on the upper right:

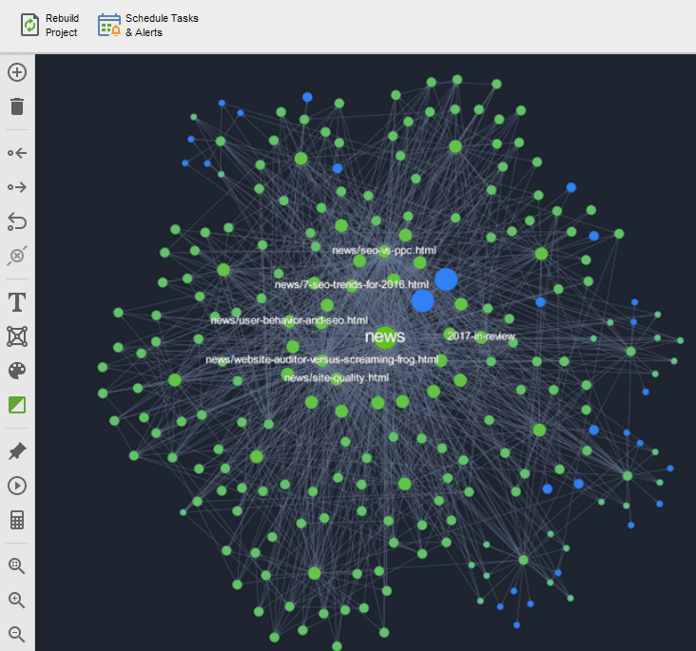
Some things should get your attention as soon as you look at the site visualization graph. For example, these lengthy strings of nodes:
If you see something of the kind, check if these strings are justified. If they appear in case of pagination, then it’s quite ok. However, if many parts of your site are linked that way, then you should reconsider your internal linking structure.
If you look at the visualization graph, you’ll see that the nodes on it have different colors. Let’s have a closer look at what it means.
Orphan pages are shown as gray nodes — these are the pages that do not have any connections with others:
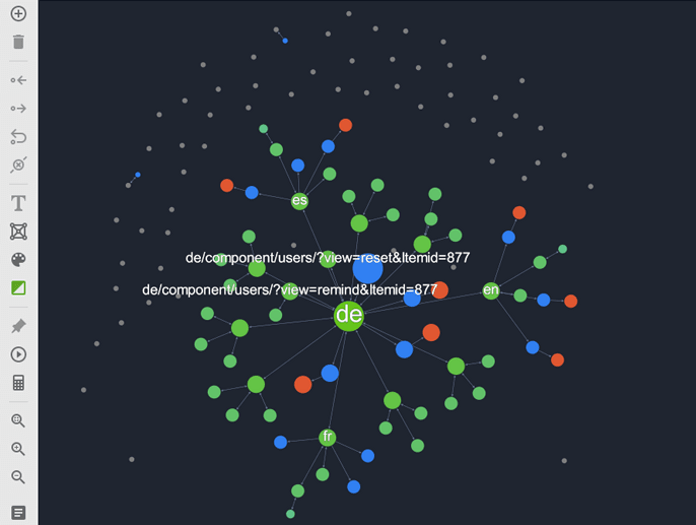
You may ask how the tool finds such pages if they do not have any connections? WebSite Auditor gets them either from Google index (in this case, there can be external links to this page but no internal ones — this issue needs to be fixed) or from XML sitemap (in this case it means that you haven't updated it for a while, and there is some old stuff you have to get rid of).
Actually, you have two options here depending on whether you need a page indexed or not. If the page is worth indexing, you can link it to other pages to make crawlers reach it. If the page is old, irrelevant, etc., and you don’t want to appear in SERPs, restrict indexing and remove it from the sitemap.
In case pages are redirected or are parts of a redirect chain, then the nodes that represent them will be colored blue.
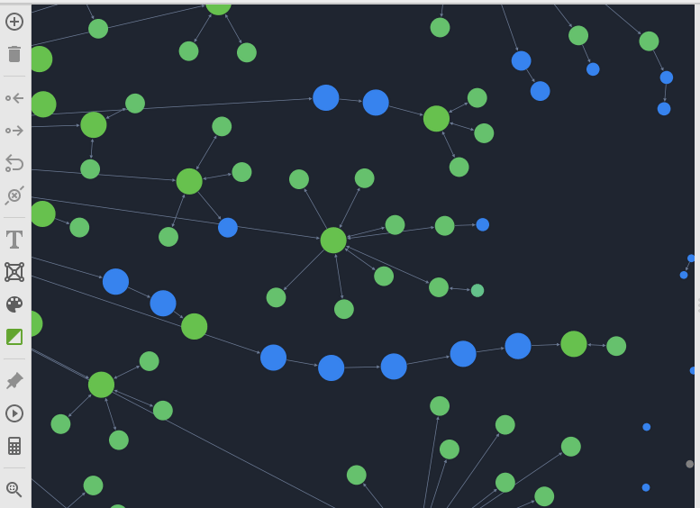

Although redirect chains may look attractive on the graph, they need to be fixed, as long redirect chains eat up your crawl budget, pass less link juice, and may slow your website down.
Broken pages are marked red and can cause you quite a lot of trouble.
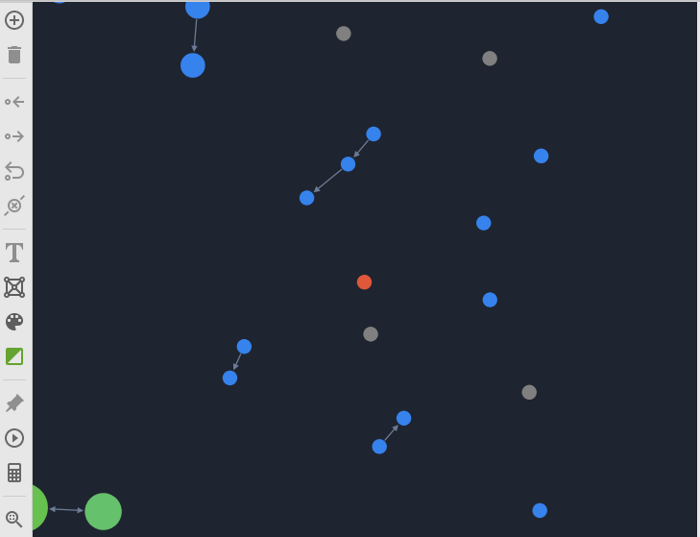

These pages are unavailable for crawlers, but they will still try to reach them. As a result, your crawl budget is wasted, and link juice is just going nowhere. Plus they cause a bad user experience.
Fix broken pages if there are any, or remove them from the sitemap and restrict indexing.
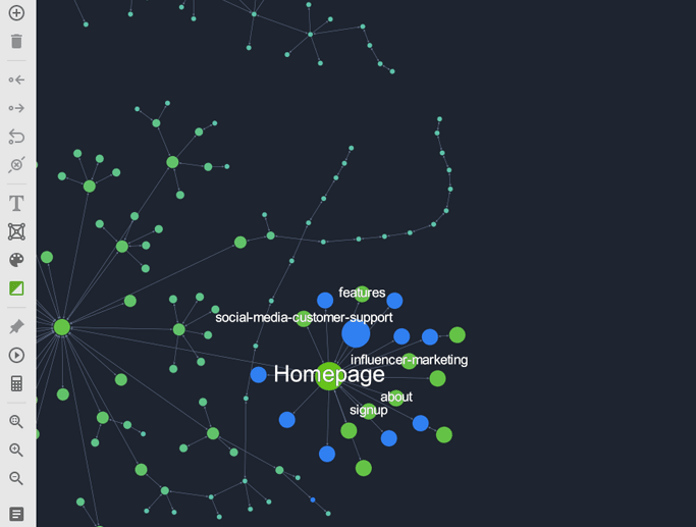
To make the visualization graph display the pages’ PageRank and show how it’s allocated, choose Internal Page Rank in a drop-down menu on the top right.
On this type of graph, the size of nodes reflects the value of Internal Page Rank — the importance and authority of a page within your site. The bigger the node is, the higher the page’s value.
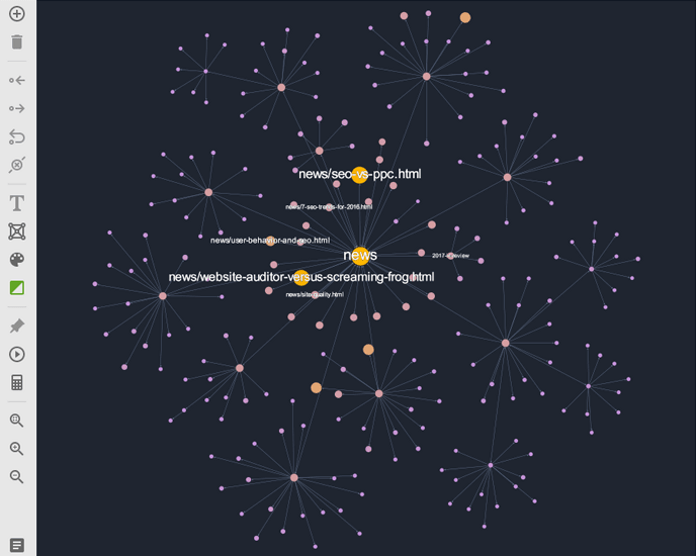
The Internal Page Rank graph helps you keep an eye on your pages’ authority and spot the places where something has gone wrong. For example, you need your homepage to have the highest PageRank, main categories to have a higher value than their subcategories, etc. If your homepage is for some reason weaker than, say, a subcategory page, you’ll see that at once on your graph. And, of course, you’ll have to investigate each case and make changes if needed.
If you wonder how to change your Internal Page Rank values in case they are inadequate, here are some strategies for PageRank sculpting that you can use.
Note. Set clear SEO goals before changing anything.
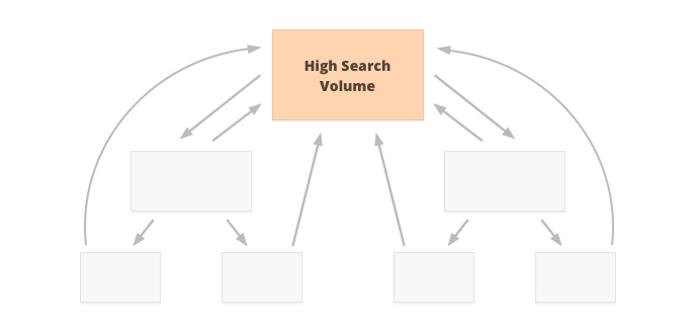
Let's take it for granted that your website is optimized for a number of high-search-volume, high-competition keywords of generic meaning (like winter fishing).
In this case, the content of your homepage is optimized to rank high for such keywords, while other pages serve to provide additional but still useful information. Such pages can include contextual links that point to the homepage. It is important to use target keywords in anchor texts of such links.
This way, the homepage will have a lot more links pointing to it than any other less important page, which will amplify the average PageRank of your site.
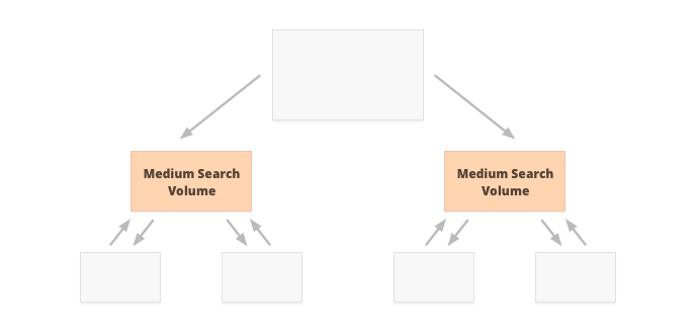
Mid-search-volume keywords are usually three-word keywords with a more specific meaning than high-search-volume ones (e.g. winter fishing equipment). They usually belong to category pages.
In this case, category pages have the highest priority, so the contextual links (with target keywords in anchor texts) should point to them.
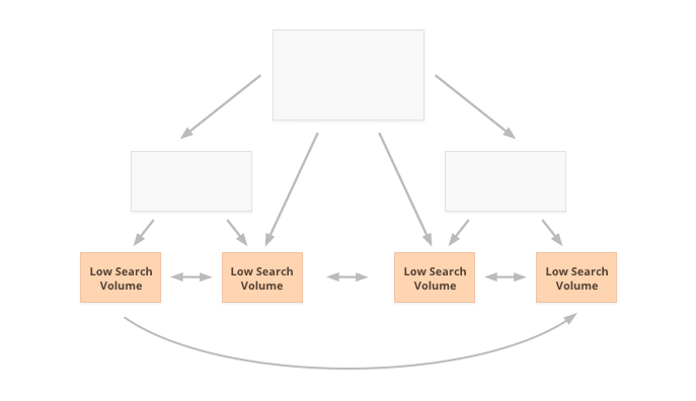
Low-search-volume keywords are usually long-tail keywords that have the highest conversion. When people search for them, they know exactly what they want. Such keywords may belong to the bottom level of a website, like individual blog posts or product pages.
If you hunt for such keywords, then most contextual links should point to bottom-level pages, and these pages should be properly interlinked.
Note that for each scenario you have to use anchor texts for contextual links consistently, i.e. use only variations and close synonyms of your target keywords.
Imagine the situation. You compete for a keyword for quite a while, but you cannot outrank some page that is less optimized and has fewer backlinks than your page. The reason for that awkward situation may be the amount of internal PageRank that page gets. Audit the competitor’s website with WebSite Auditor and visualize their Internal Page Rank allocation to investigate the case.
The truth is that most tools don’t pay much attention to internal PageRank and focus on backlinks only. And many SEOs fall for this mistake, too. Don’t be like them.
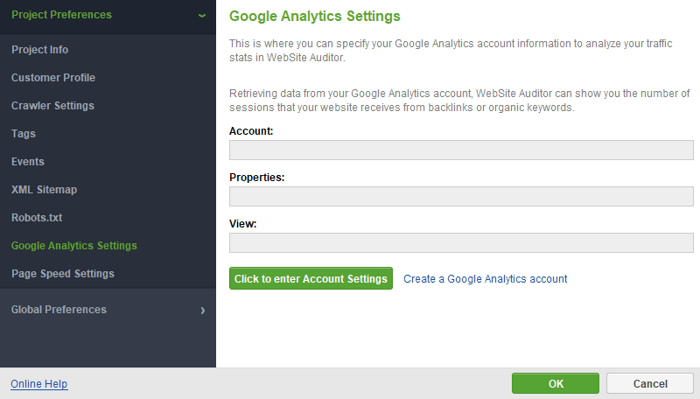
Note. For this step, you will need to connect your Google Analytics account. You can do it in Preferences > Google Analytics Account.

Then update your data in Site Structure > Pages. Once done, go back to the Visualization dashboard and rebuild your Pageviews graph.
The size of nodes here reflects the value of Pageviews. The bigger the node is, the higher value the page has.
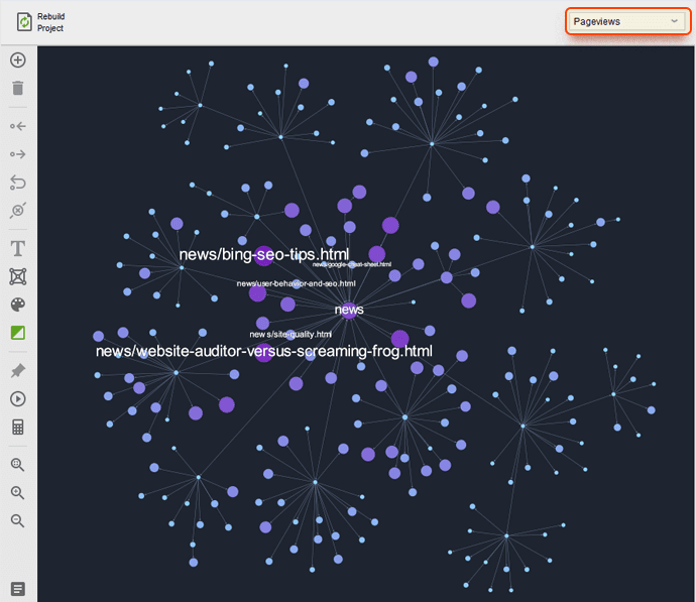
This graph lets you check traffic flow across your website at a glance. Which I think is an extremely nice addition to all of your spreadsheets and GA tables.
The Pageviews visualization graph is a perfect way to see if your conversion pages get enough traffic — make sure that the most traffic-rich pages point to them. If not, adjust your structure by adding links from popular landing pages to conversion pages.
WebSite Auditor’s Visualization module lets you edit your site structure and visualization graphs any way you want:
Once you understand what you can get from different kinds of visualizations, you can go on and apply the necessary changes in pursuit of a perfect website structure.
By clicking on any node, you enter the editing mode. Using the action buttons on the left, you can:
Add a page.
Remove the selected page from visualization. (Or just hit Delete on your keyboard).
Add Incoming Link. It is possible to add a few links at once.
Add Outgoing Link. It is possible to add a few links at once.
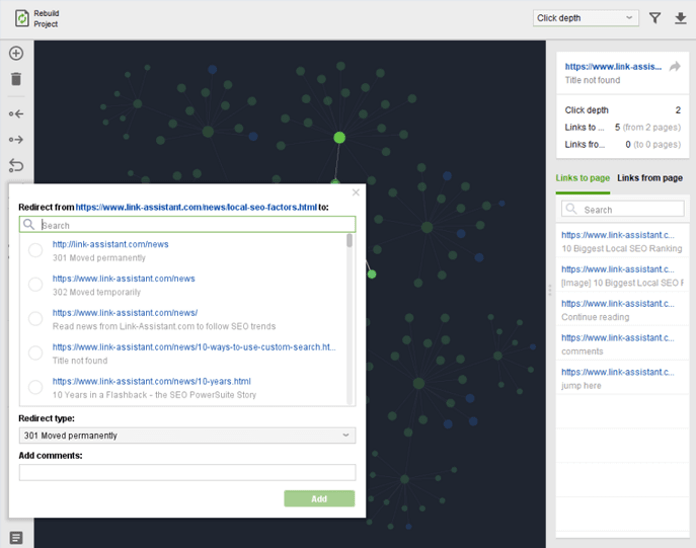
Create a Redirect Link.
Remove the selected link.
All the actions are accompanied by pop-up windows where it is possible to find pages you would like to add, link to, redirect to, create anchors to, etc. as well as add some comments for your further convenience:
You can make your graph even handier for usage by applying a personal touch:
Change the theme of the background (light or dark). It is an aesthetic thing, as well as a way to protect your eyesight.
Mark the selected page. By adding text and color labels to some nodes, you will be able to distinguish the most important pages or pages that you work at. Note that when you first visualize your site structure, some of the nodes will be marked automatically. These are the pages with the lowest Click Depth and the highest Page Rank.
Pin nodes to a certain part of your screen. This way these nodes stay where you pinned them when you rebuild your graphs after some changes. You can still drag pinned nodes manually to the places you need to.
After you have made some changes, I think you will be genuinely interested in how they’ve influenced your site structure in terms of Click Depth and PageRank values. Just click
button to recalculate your values.
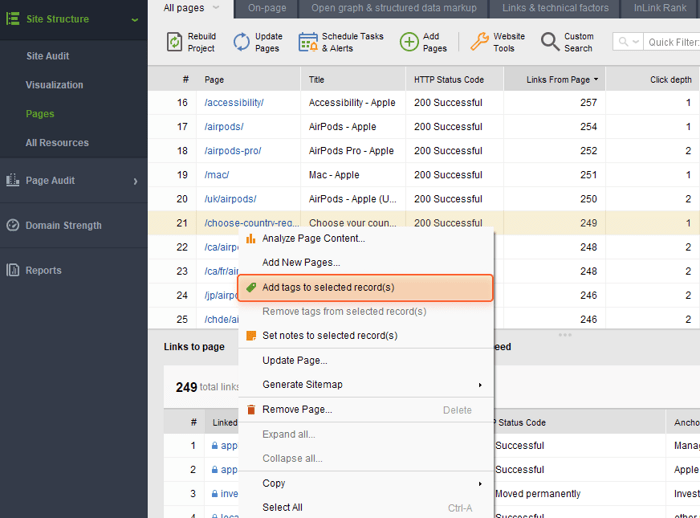
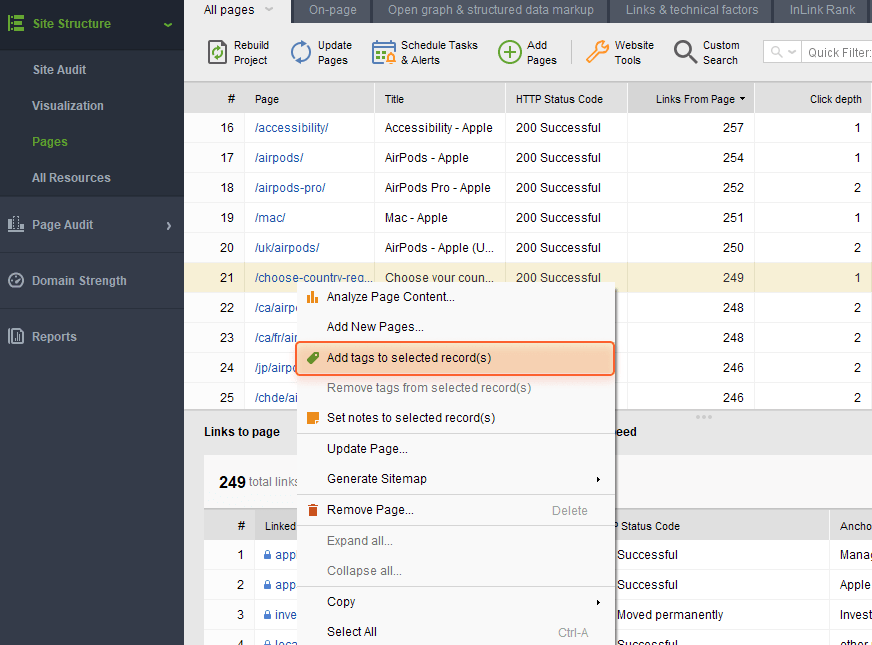
In WebSite Auditor, you could add tags to some pages of a particular type. Or you may do so in the Pages dashboard: right-click on the needed page(s) and choose Add tags to selected record(s):
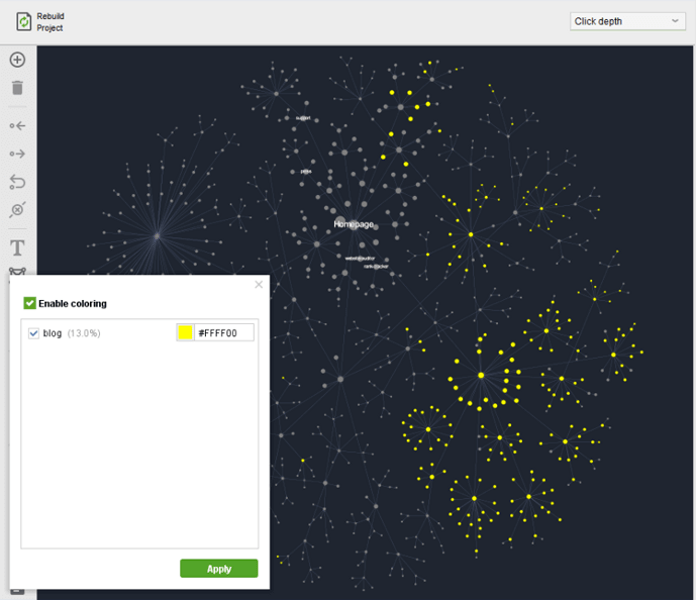
Once you tagged pages, go to the Visualization module, click the palette button
, and set up specific colors for each of your tags. This way, it is possible to either highlight some pages of a particular topic (and reveal interlinking connections between them) or filter out some unnecessary pages.
There are several scenarios when you may want to tag your pages. What comes to my mind at once:
PageRank investigation
The pages within your site can work as an ecosystem — each has its functions thus complementing each other. For example, by linking to the pages with lower PageRank scores, pages with the highest PageRank can give an authority boost to the latter.
Go to Pages > InLink Rank, sort your pages by InLink Rank (which is an in-app alternative to external PageRank), pick the most prominent ones and the ones that need some boost, and tag them correspondingly.
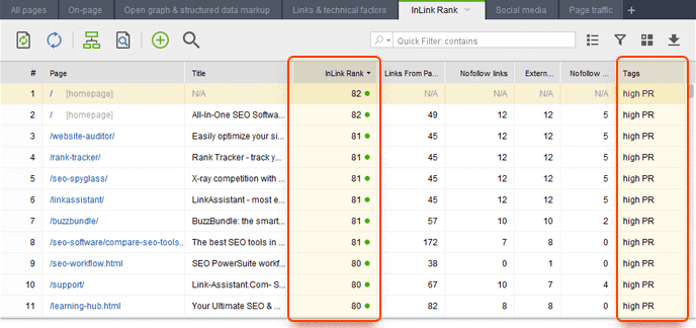
In the Visualization dashboard, color these two groups by tags. Check what you spend your highest PageRank on. Think whether it is possible to direct it to those pages that need some ranking boost.
Topical clusters investigation
It's no secret that topical clustering is useful for your site. Why? By interlinking your posts on a particular subject, you are creating a field of expertise (this also solves the problem when your good content is buried under click depth). Here you may want some of the most prominent or the most up-to-date posts to rank higher.
Here is what you can do: go to Pages, search for a particular topic that you know you have lots of quality content about, leave only the relevant pieces, and tag them appropriately. Then go to the Visualization dashboard and analyze the connections between the tagged pages.
For example, I took a website and tagged all the posts that deal with, say, Easter bunnies, pink. As you see, they are not quite interlinked:
The strategies for topical interlinking are as follows:
The changes you make in-app are not automatically applied to your site. However, you can easily export them as a to-do list either for yourself or for your team/webmaster.
By clicking
button at the bottom of your action panel, you can discard all the changes/the last change, or export a final list of changes in CSV:
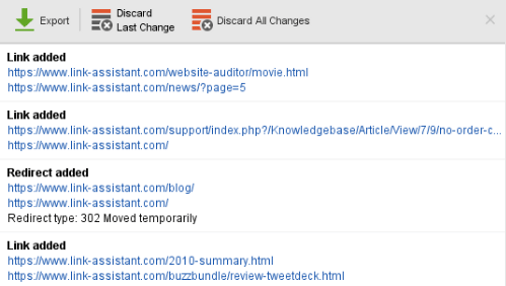
What's more, by clicking the Export button in your dashboard, you can export all pages (or all links) in CSV. Or you'd better save the PDF file with the graph image and send it to your client.
If you decide to introduce any changes to your internal linking strategy and PageRank distribution, make use of bulk interlinking options instead of hopping from page to page and pasting links throughout their content. These options are as follows:
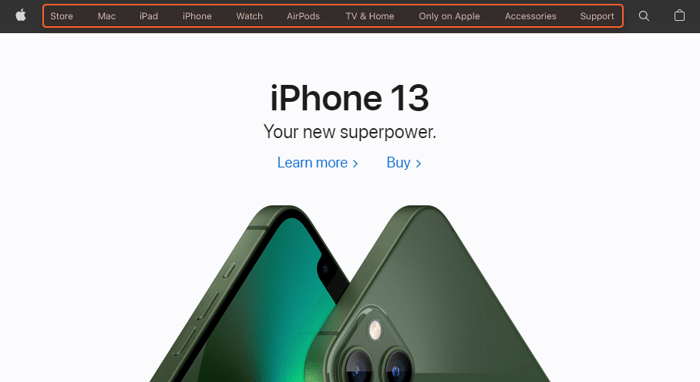
Navigation menu
Navigation menus let you make most of your key category or even individual pages one click away from the homepage. This, in turn, speeds up the crawling and indexing of your site. Menus are usually placed at the header of the page:

One more option is to put a menu on the left:


Breadcrumbs
Breadcrumbs help users understand where they are on your website and how they got there. They also let you arrange your content by categories and form a pillar site structure, which can help you get more context around your entity. Plus breadcrumbs help search bots better understand your site’s hierarchy.
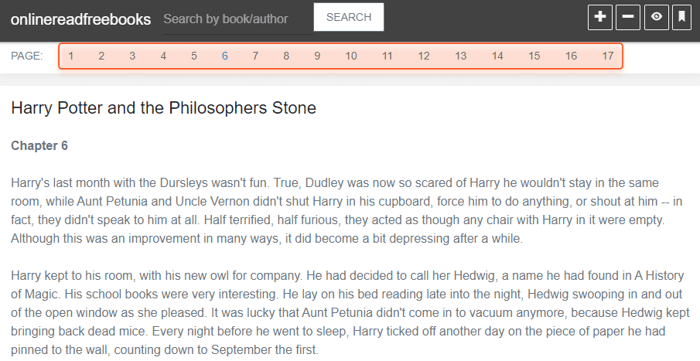
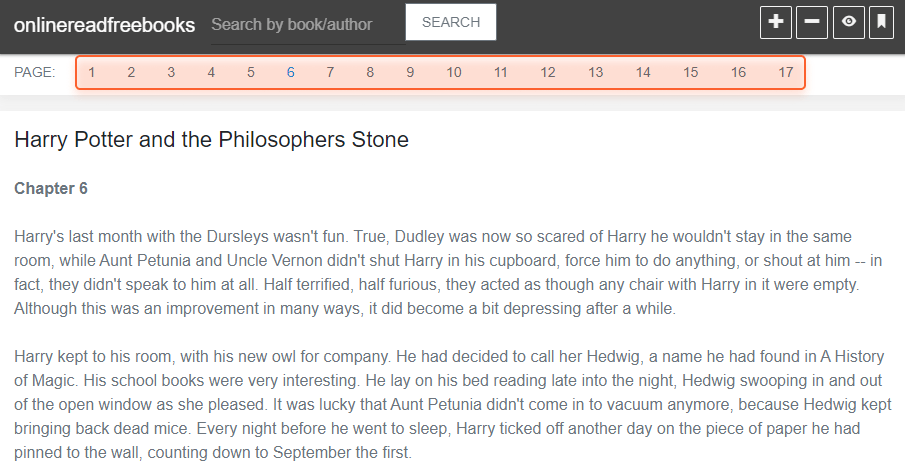
Pagination
Pagination is common for websites that allow online reading of books and news, watching movies, etc., i.e. websites that have many consequently arranged pages. Pagination decreases click depth, as any page in the row becomes one click away from the page a user is currently viewing.
Footer
Using the footer as the only menu on your website may not be the best idea. Still, the footer is a perfect place to put links that point to privacy policy pages, FAQs, terms of use, etc. to make those pages one click away from the homepage. These pages are important for Google, so it’s better for you if Google finds them quickly.
Linking blocks
This type of interlinking is commonly seen on blog pages (also read, related posts) and ecommerce websites (you may also like sections).
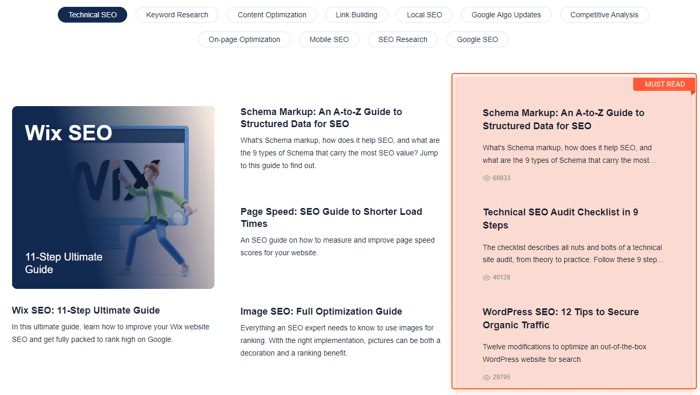

Such blocks are a good way to lure traffic to the pages you need to strengthen. Plus it is a nice way to add more context to the topic.
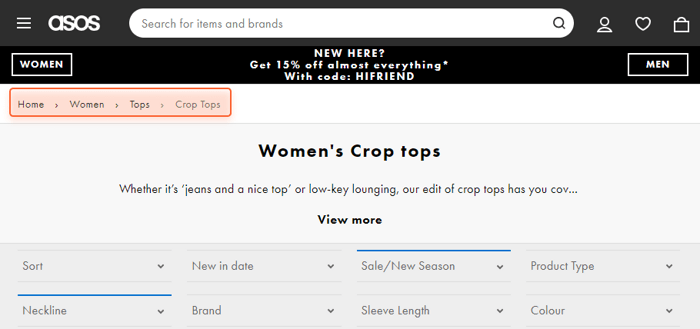
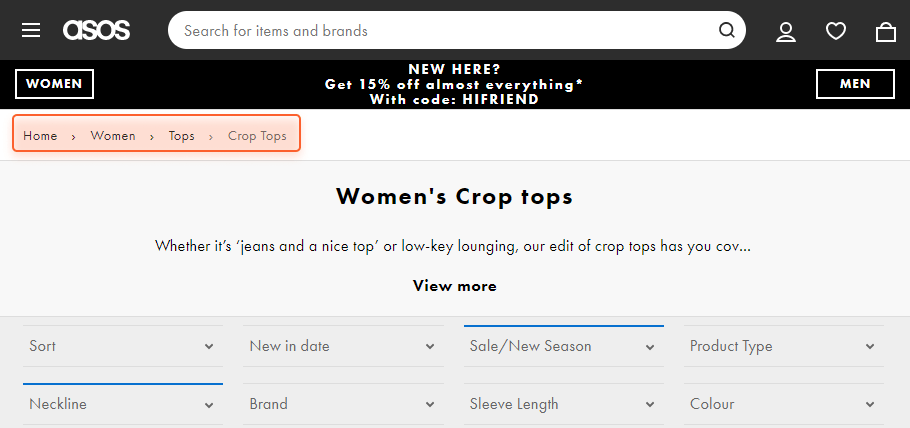
Filtering
Filtering is most common for ecommerce websites that offer a lot of variations of one product type:

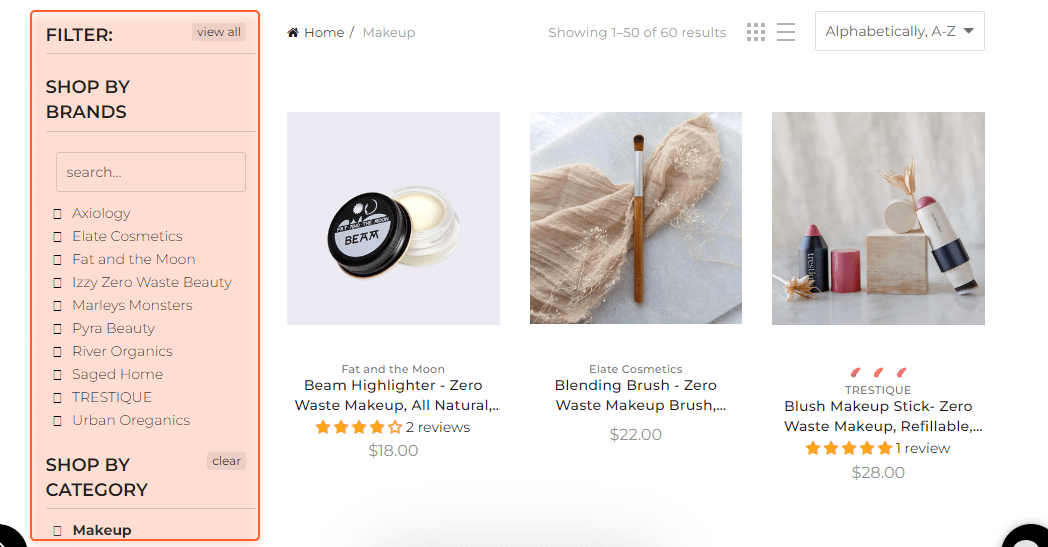
This option helps users navigate through your products and customize options to choose the goods they need, thus reaching the necessary page within one click instead of wandering through the website for quite a long time.
Tags
You may have seen tag navigation on job application sites and news agencies.

Tags work similarly to related posts, offering users more content on the topic they may be interested thus forming enough context around an entity and decreasing click depth greatly.
The truth is that there are way too few tools that have an option to visualize your website structure based on click depth, PageRank allocation, etc. So the importance of this aspect of website audit is greatly underestimated. With WebSite Auditor’s Visualization tool, you can easily spot all the issues with your site structure, refine it to perfection, get a ready technical task to pass to your dev team, and save you tons of time.
How do you actually use visualization tools? Share your stories in our Facebook community.