3834
•
9-minute read


Google has been changing the rules of the organic search game for more than a decade, and if you’ve been doing SEO for over five years, you already know that getting organic traffic has never been more challenging.
This pushes us to look for new, original ways to grow website traffic in these turbulent times. One of those ways is creating data-driven visual content, better known as infographics.
In this guide, we’ll cover the different types of infographics, how to create them, how to optimize them, and how to make sure they help you earn links and traffic.


An infographic is a combination of data and text presented in a visual format. In many cases, infographics are used to break down complex topics with the help of charts, graphs, and other visual elements. Here’s an example of the on-page SEO infographic we created for our blog:
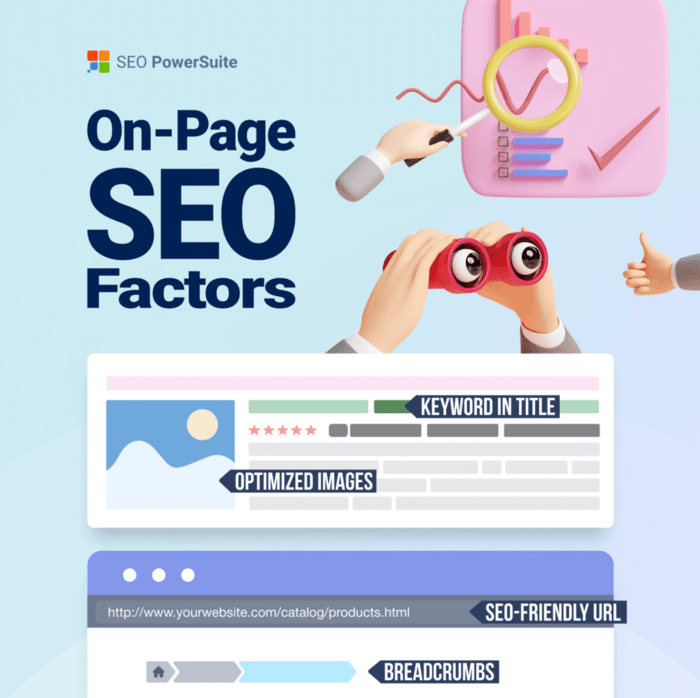

What other types of infographics can you create? The list is almost endless — mind maps, line charts, tree diagrams, histograms, pie charts, and more. The important thing is to choose a relevant topic and make sure your graphic is visually appealing.
The on-page SEO infographic above has earned over 80 backlinks for the article page — a solid reminder that visual content naturally attracts references. This is well known in the industry: infographics tend to earn links, and those links directly contribute to stronger organic rankings.
Infographics also work well beyond traditional SEO. Pages that include clear, helpful visuals are increasingly favored by modern LLMs like ChatGPT, Gemini, and Claude. These models often surface pages that present information in a structured, easy-to-digest format, which gives well-designed infographics a natural advantage.
There’s also a user-experience angle. Infographics typically increase engagement time on the page — a metric you can track in Google Analytics. The pages with higher engagement time in the screenshot below are the ones that include infographics:
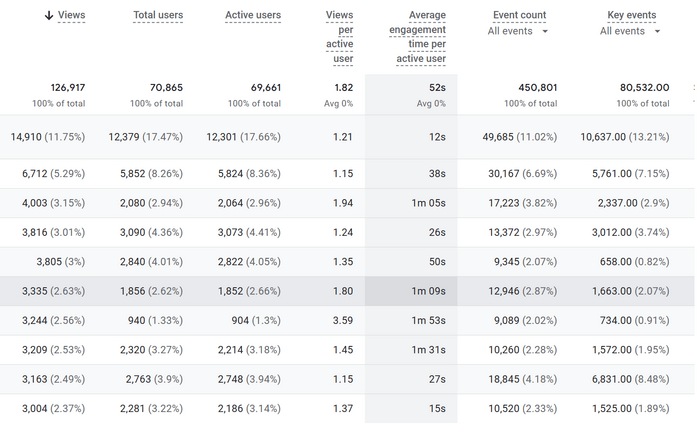

When visitors spend more time engaging with your content, it sends positive signals to Google that your page is relevant and deserving of higher positions.
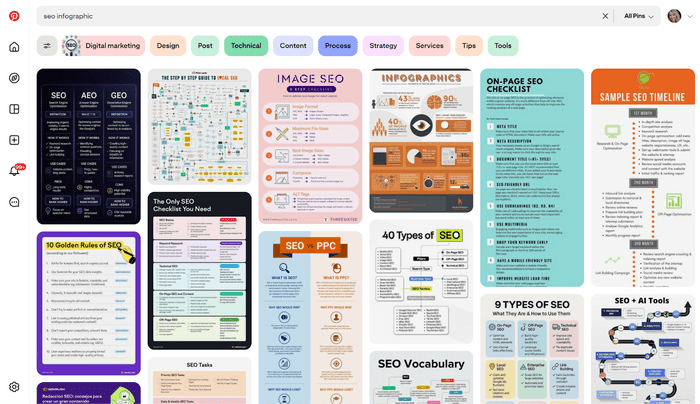
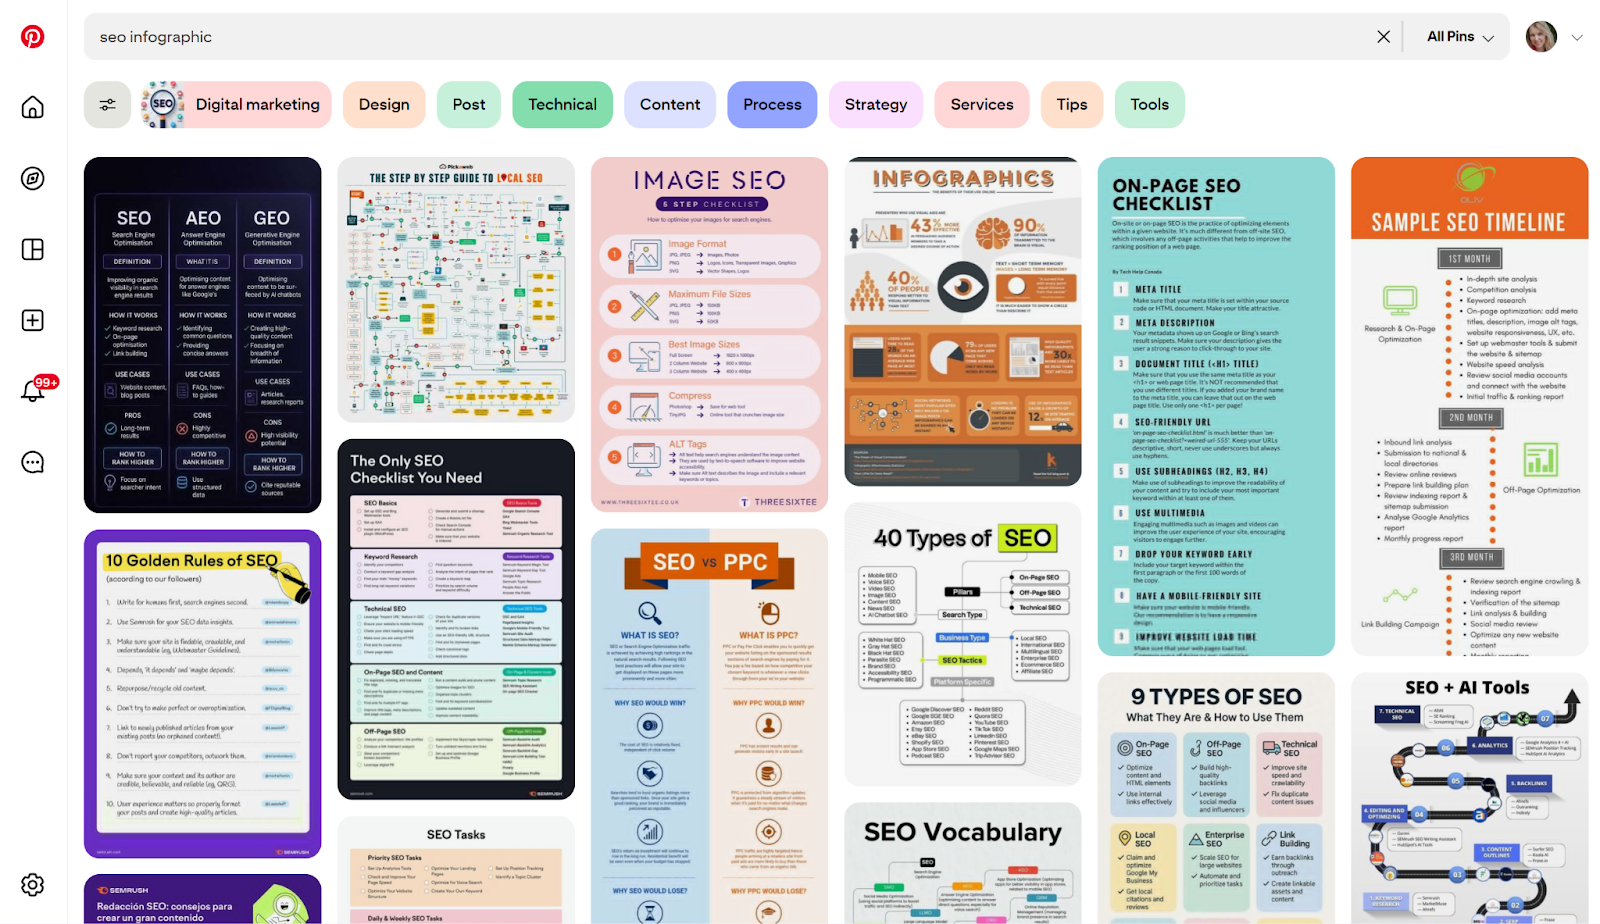
Finally, a well-optimized infographic can bring in traffic from image search itself, including Google Images, Bing Images, and other visual discovery platforms. This creates an additional stream of organic visitors you might not reach with text-only content.
Creating and optimizing a good infographic can seem like a challenging task, but once you’re equipped with the checklist below and a few well-tested industry tools, things start to look much easier.
Let’s dive in!
How do you choose which infographic will be effective and actually bring traffic to your website? Just like with any page you want to rank, it’s important to pick the right topic and identify the relevant keywords to target.
Using a keyword research tool like RankDots, you can collect topic ideas in a matter of minutes, and for each topic, you’ll get a list of subtopics and keyword variations.
For example, when I researched the topic ecommerce email marketing, I got a range of ideas such as email list building, email performance and analytics, email design and templates, email marketing strategy, email automations, and more.
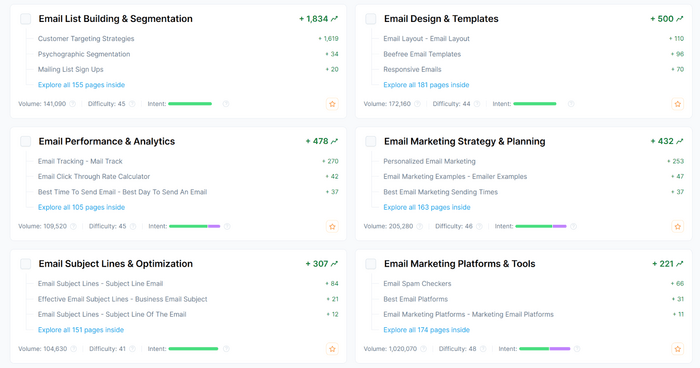
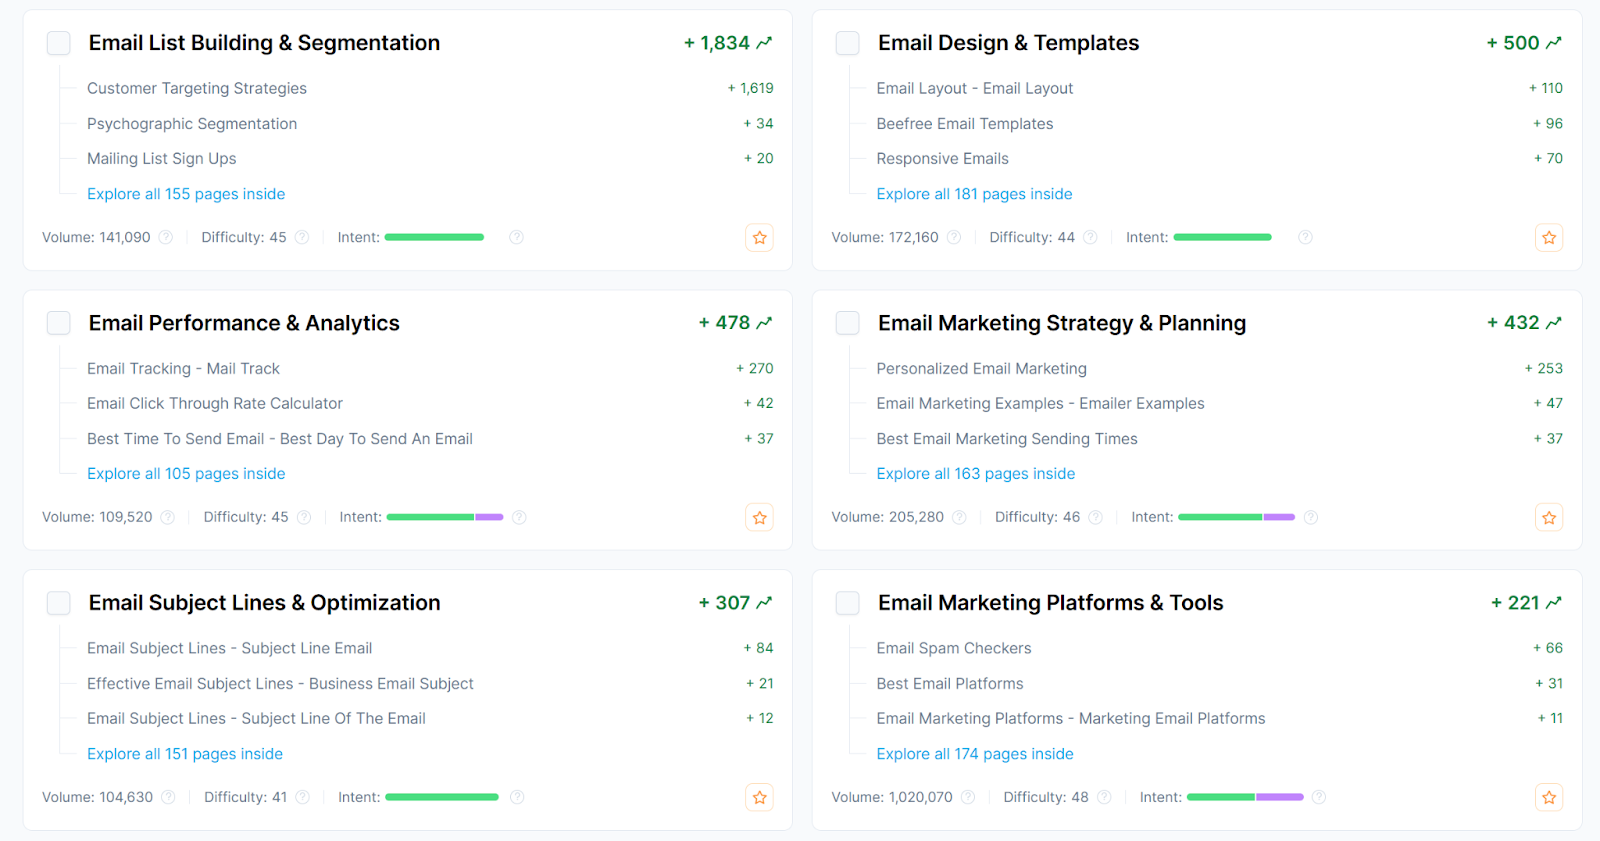
And each of those topics included dozens of relevant page ideas:
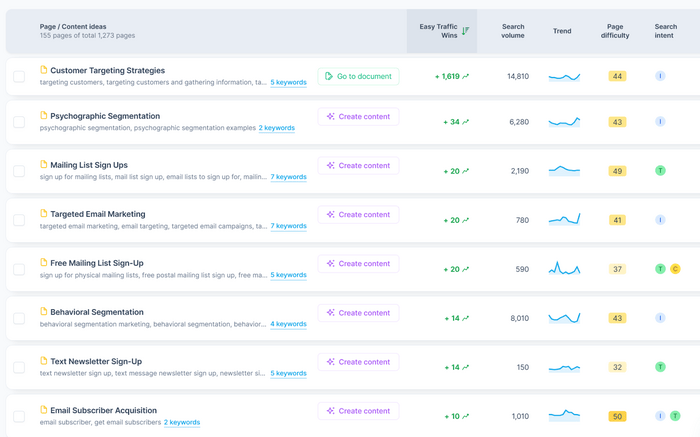
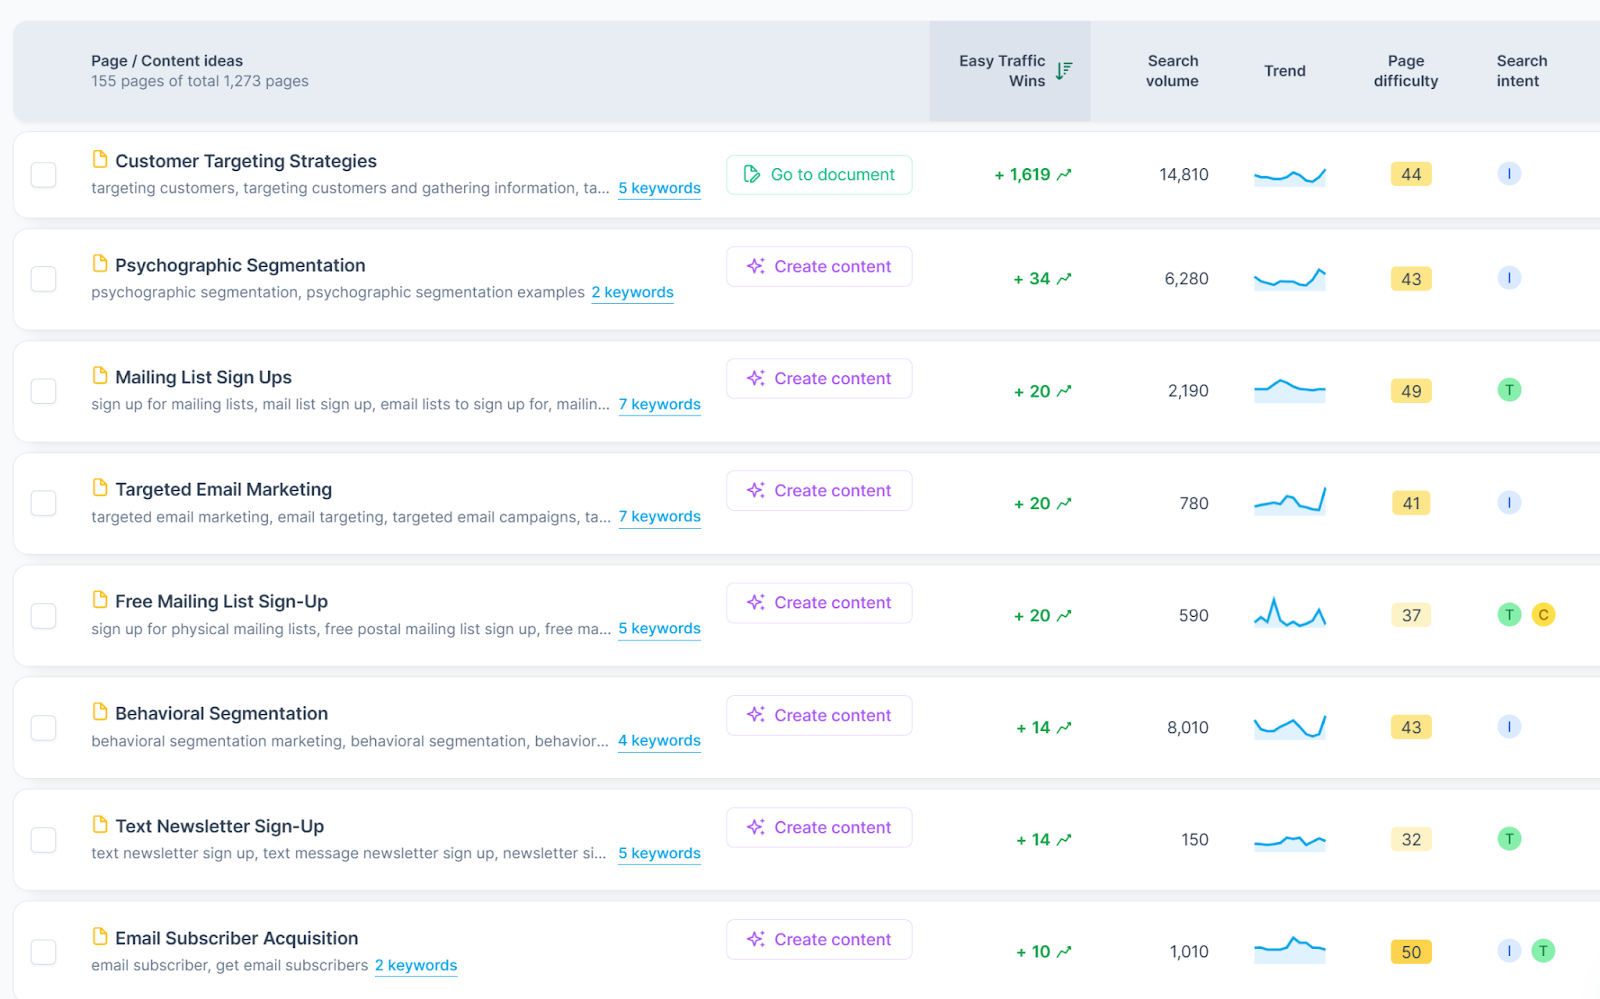
So, if I wanted to create a series of infographics on email list building, I could focus on topics like customer targeting strategies, behavioral segmentation, psychographic segmentation, and so on.
Not sure which topic or keyword to tackle first? A good rule of thumb is to focus on the ideas with the highest Easy Traffic Wins score. This metric highlights the keywords where ranking is realistically achievable because competitors aren’t heavily optimized. If you rely only on search volume, you may end up choosing keywords that are extremely competitive and difficult to break through.
If you use Rank Tracker for keyword research, you can easily find the most relevant and high-traffic terms using this process:
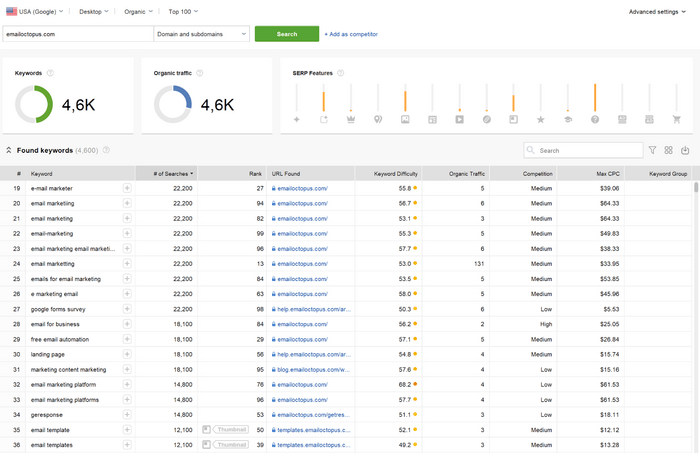
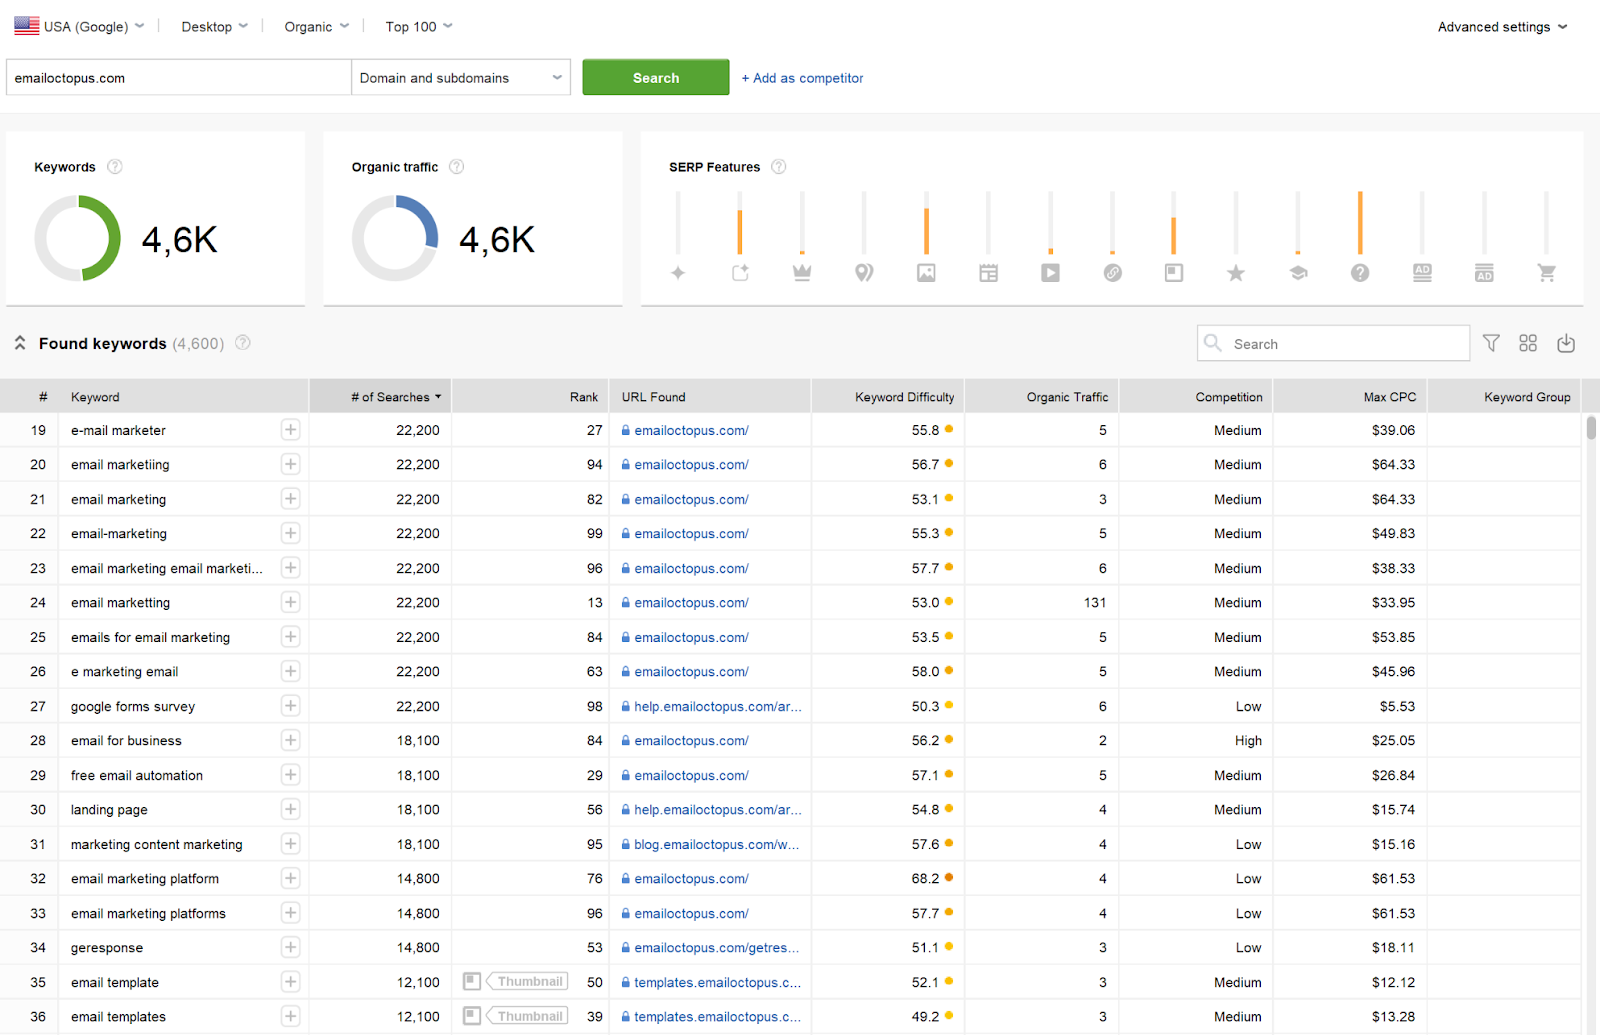
This quick workflow helps you validate your ideas and focus on topics where your infographic has the highest chance of ranking well.
Okay, now that you know what your infographic will be about, you can move on to the interesting part — actually building the graphic.
You don’t need a design background to create an infographic that looks polished and performs well in search. Today’s tools make it surprisingly easy to turn raw data or research into something visual and share-worthy. Here are the simplest approaches to get started.
1. Use drag-and-drop design tools
If you want the fastest route, tools like Canva, VistaCreate, and Piktochart offer ready-made infographic templates. Just pick a layout, replace the placeholder text, drop in your stats or icons, and export.
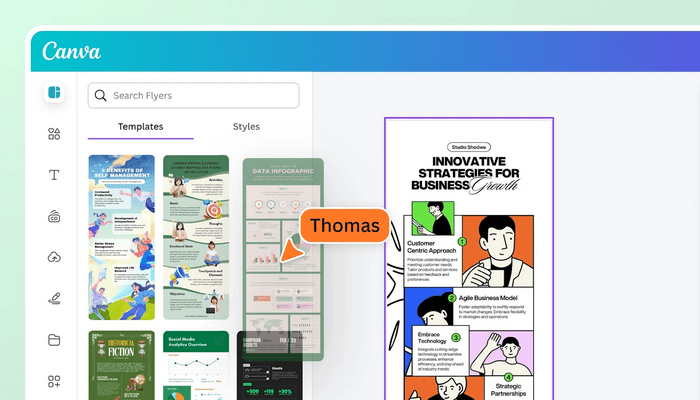

These tools are very beginner-friendly and don’t require any design knowledge at all.
2. Build more polished layouts in Figma
If you want a bit more control over spacing, typography, and branding, Figma is an excellent step up. It’s still easy to use but offers far more flexibility than template-based editors.
Many marketers build their infographics in Figma because it’s free, collaborative, and makes it simple to maintain consistent styles across multiple visuals.
3. Use AI to speed up the creative process
AI tools won’t design the final infographic for you (yet), but they’re incredibly useful for planning.
You can use ChatGPT or Gemini to generate structure, titles, color recommendations, icon lists, or even draft layouts. This is especially helpful when you’re starting with a blank page and need a quick content outline to bring into Canva or Figma.
4. Combine your data with simple charting tools
If your infographic includes charts, build them in tools like Google Sheets, Flourish, or Datawrapper, then export them as images and place them into your design.

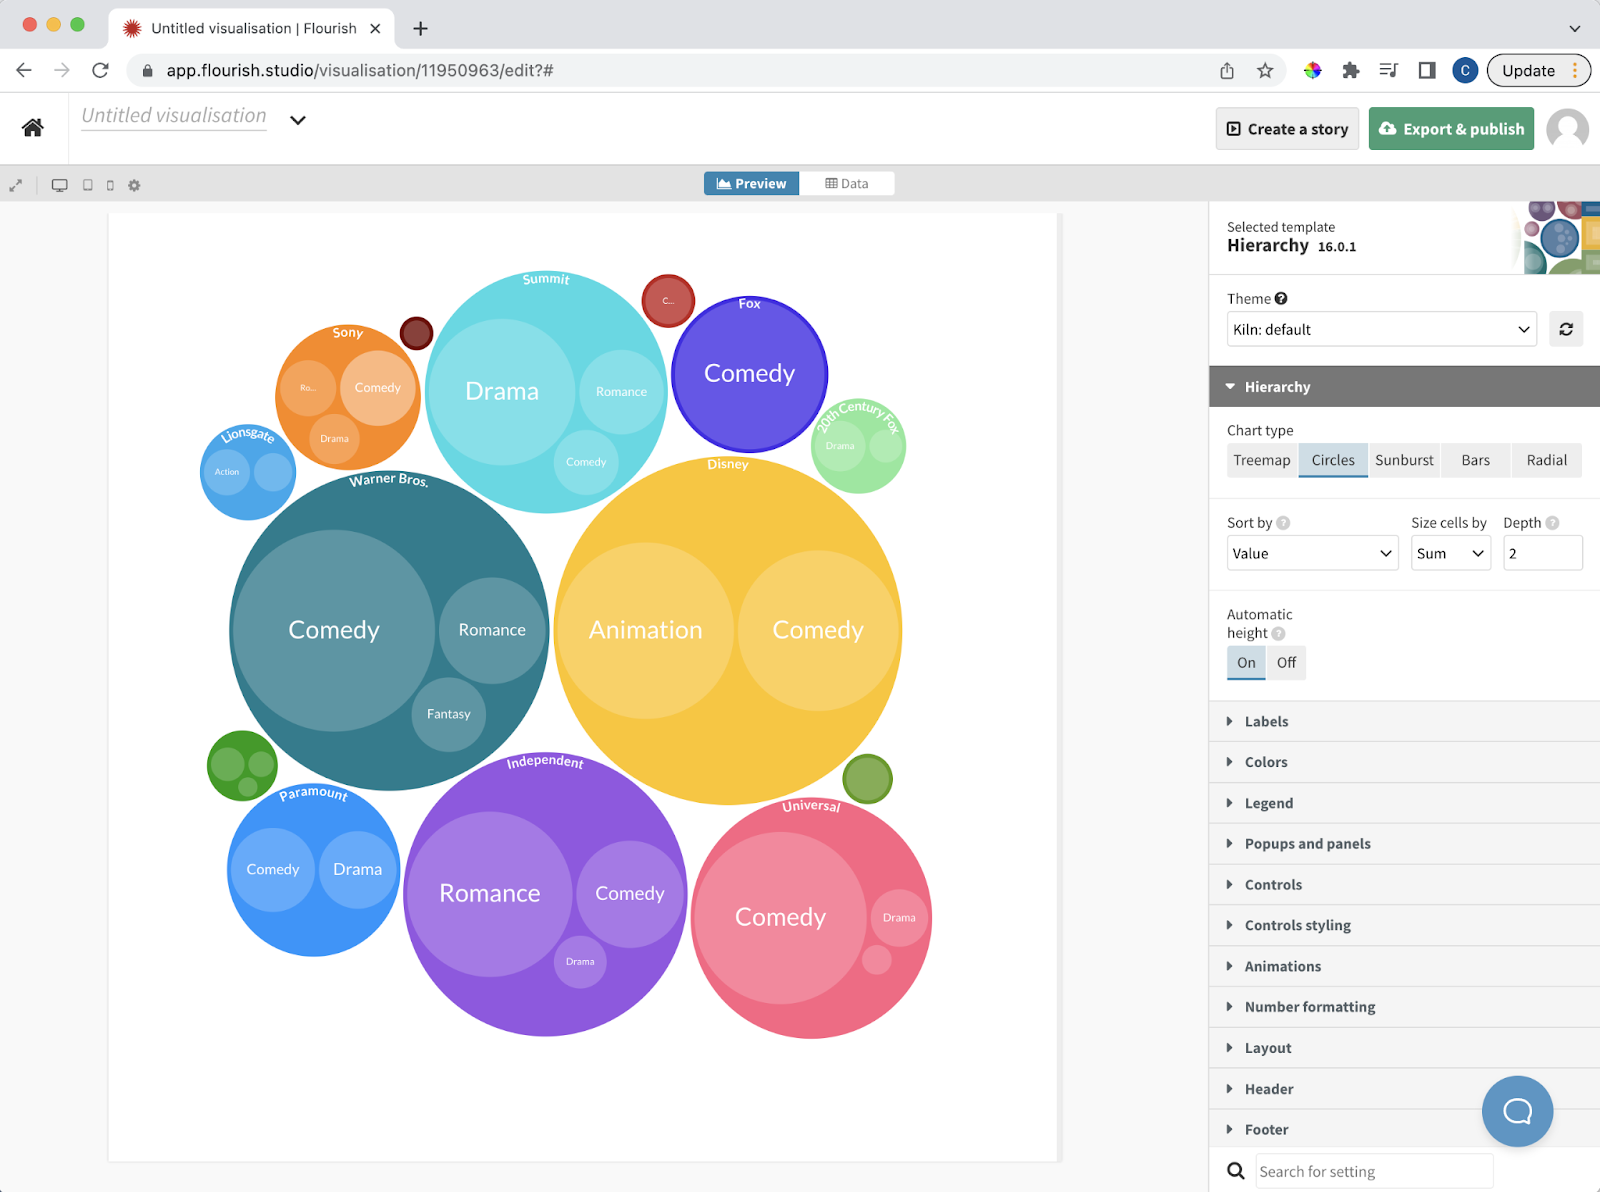
This keeps numbers clean, accurate, and easy to update later.
5. Keep it simple and consistent
A good infographic isn’t about fancy effects. Aim for clear hierarchy, readable text, and consistent spacing. Whether you’re using Canva or Figma, stick to 2–3 colors, align elements carefully, and leave enough white space so the information is easy to digest.
Now that your infographic is ready, it’s time to add the on-page content that will help it rank. Keep your list of keywords and topics from Step 1 close by — you’ll use them throughout this section of the page.
1. Write a catchy, optimized headlineYour headline should include the main keyword and still sound natural.

A simple way to do this is to combine the keyword with a number or a clear benefit. For example:
Both titles include the target keyword, set expectations, and encourage the click.
2. Write the main content for the infographics page
Don’t leave your infographic to stand on its own. Add a short intro that explains what the infographic covers and why the topic matters. You can also highlight 2–3 key takeaways from the visual. For example:
“This infographic breaks down the most effective email list building tactics, from segmentation basics to advanced automation workflows. We’ve included real examples, performance benchmarks, and simple tips beginners can apply right away.”
If you use data or statistics in your infographic, mention the sources here as well. This builds trust and can help your page appear more authoritative.
3. Add internal links using relevant keywordsUse your target keywords as natural anchor text and point to related blog posts or guides. For instance:
This sends strong relevance signals to Google and helps users navigate deeper into your site.
4. Write a good meta description for your infographic page
Your meta description should briefly explain what the infographic offers and why users should click, for example:
“Explore our infographic on email list building strategies, including segmentation tips, automation ideas, and proven tactics to grow your audience.”
5. Check the page URL structure
Keep the URL short, readable, and keyword-focused. Something like:
End the section with a CTA that encourages engagement. You might say:
A small CTA like this can increase shares, links, and repeat engagement — all of which help your infographic perform better in search.
Now that your infographic is ready, make sure the file itself is optimized for search engines — because in most cases, Google Images will be one of your biggest sources of organic clicks.
A few small tweaks can make a big difference in how quickly your image gets indexed and how well it ranks.
1. Pick a relevant file name
It’s tempting to save your graphic as something like “New_image_07.png”, but this tells search engines absolutely nothing. Use a clear, keyword-focused file name instead, for example:
onpage-seo-infographic.png or email-list-building-tips-infographic.webp.
This helps Google understand what the image is about right from the start.
2. Add an optimized alt text for your infographic image
Alt text is another simple but important step. It lives in your page’s HTML and tells Google (and users) what the image represents.
Try to include your main keyword naturally. For example:
“Infographic showing strategies to increase blog traffic.”
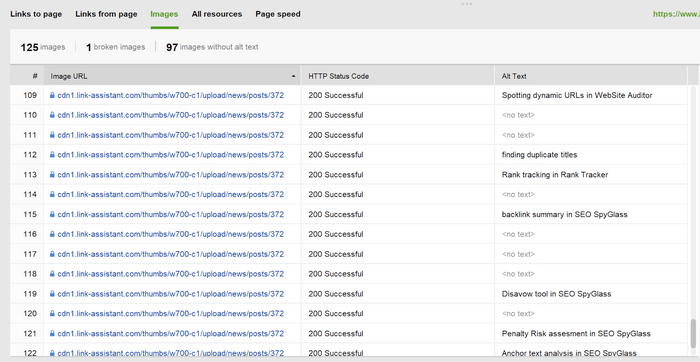
Alt text also shows up if the image fails to load, and it’s essential for accessibility — screen readers rely on it to describe your content to visually impaired users.
If you’re unsure whether your site has gaps here, it’s worth reviewing your existing alt texts. You can do this quickly in WebSite Auditor. Just create a project, let it crawl your site, and check the Images dashboard under Site Structure > Pages to spot missing or weak alt attributes.

3. Choose the best file type and resolution
Your infographic should look crisp everywhere — desktop, mobile, or even when someone embeds it on their site. Google recommends using large, high-quality images (at least 1200px wide), as these have a better chance of appearing in image-rich search features.
Before uploading, compress the file so it loads fast without losing quality. Tools like TinyPNG, Squoosh, or your design tool’s built-in export settings work well.
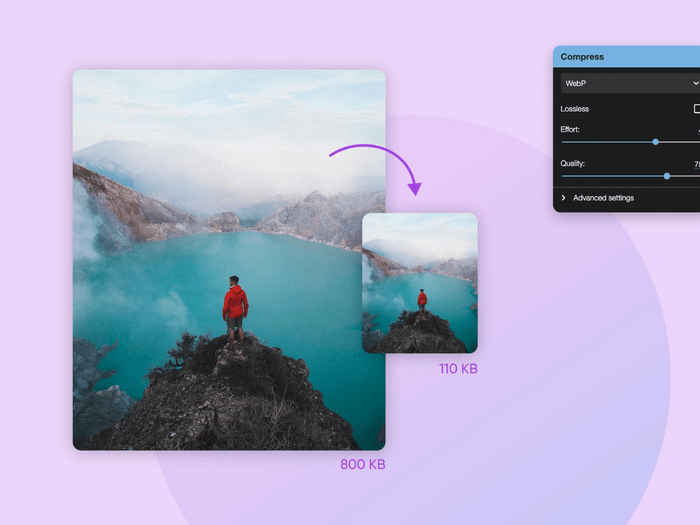

As for formats, the most SEO-friendly options are:
Using the right format ensures your infographic loads quickly, stays sharp, and has a better chance of ranking well in Google Images.
Now that your infographic is optimized and ready to go, you’re all set for the final step — getting it in front of people.
The day has finally come for the world to see your masterpiece — but hold on, it’s too early to refresh your traffic reports expecting a spike. First, you need to give your infographic a little initial traction, and here are a few simple ways to do that.
1. Share it across your social channels
Post the infographic on LinkedIn, X, Facebook, Pinterest, and Instagram. Add a short caption with a link back to the full article. Pinterest in particular drives long-tail traffic for visual content.
2. Turn sections of the infographic into smaller social visuals
Crop key panels or stats and share them as standalone images. Each post gives you another chance to link back to the main page.
3. Republish it on community platforms
Upload the infographic to places like Reddit, Quora, Imgur, or Pinterest boards where your topic fits naturally.

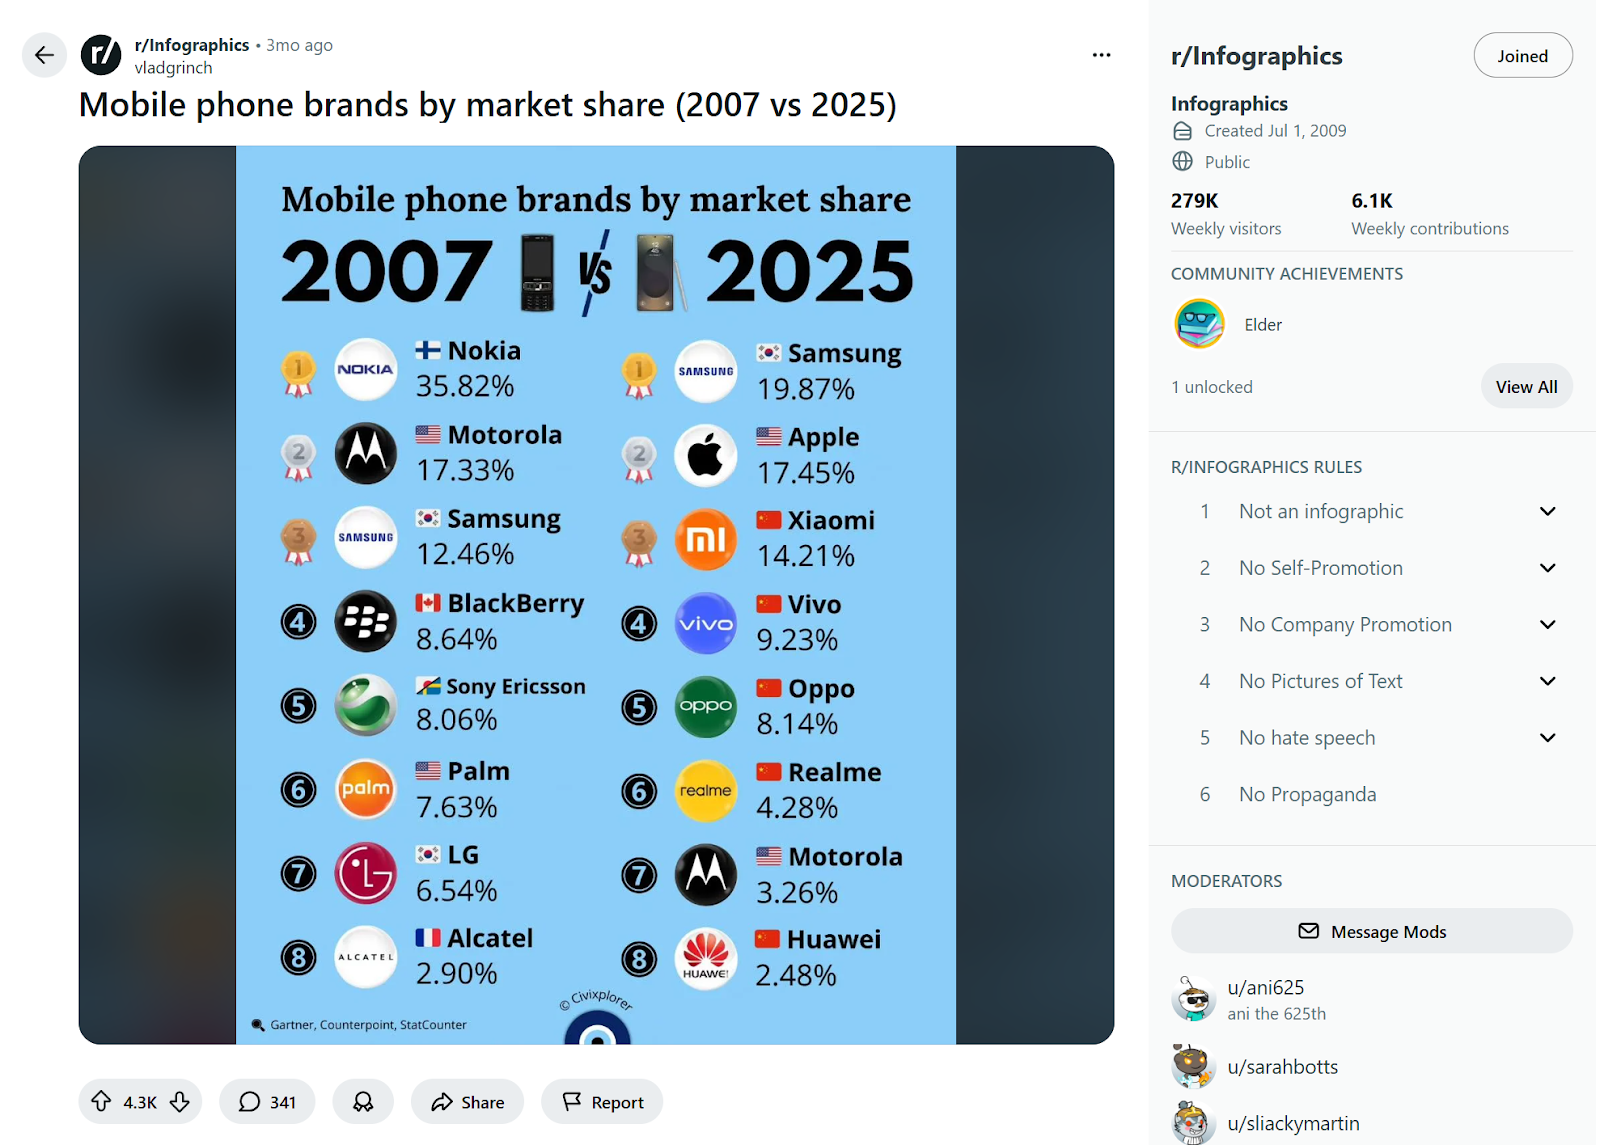
Don’t be pushy — just share it in threads where people ask for data or resources.
4. Share it in your newsletter
Even a small list can drive early traffic and social shares. Include a small preview image and a CTA to view the full infographic.
5. Convert it into additional formats
Turn the infographic into:
Upload these formats with a link back to the original page.
6. Post it in relevant Slack or Discord communities
If you’re part of professional groups (SEO communities, marketing groups, creator groups), share it in the appropriate channels — these communities often appreciate high-quality resources.
7. Share it in roundups of your own content
If you occasionally publish “Best resources this month”-type posts or collect data-driven articles, include your infographic as one of the featured resources.
8. Embed it in guest posts you’re already writing
If you ever publish guest content, simply reuse the infographic where it fits naturally — no special outreach required.
Infographics remain one of the most reliable ways to earn attention, links, and long-term organic traffic — especially in a search landscape where clear, visual, data-driven content stands out.
Once your infographic page is live, don’t forget the final step: track how it performs over time. Search rankings can fluctuate, especially for visual content that competes in both traditional and image search results. A tool like Rank Tracker makes it easy to monitor your target keywords, see how your infographic moves in SERPs, and identify new opportunities to strengthen the page with additional links or internal anchors.
Create something genuinely helpful, make it easy to find, give it a gentle promotional push — and your next infographic may become one of the highest-performing assets on your site.


| Linking websites | N/A |
| Backlinks | N/A |
| InLink Rank | N/A |