•
9-minute read


Search optimization is not an exact science. A lot of what we do in SEO is based on assumptions and has some probability of working, but it's often hard to tell whether it actually does. That's why it's important to arm yourself with a few trusted metrics, so you can both measure your results and identify new optimization opportunities.
In this article, I will look at the most important SEO KPIs (key performance indicators), as well as the tools where these metrics are found. Measuring the effects of SEO will help you see whether you've chosen the right SEO strategy and keep you motivated to continue optimizing your website.
The key to success of any SEO campaign is about how you set your SEO goals and how you get the impact measured. That’s where marketers play the lead because, generally speaking, the main objective of any business is increasing profit. You always measure SEO metrics and evaluate SEO efforts together with your digital marketing team. And, in terms of tracking SEO KPIs, a successful website optimization means reaching a better targeted audience, with less money spent on it.
The ultimate goal of SEO is to get more users from search engines, so the main KPI you'd want to track is SEO traffic. A thing to look for is a continuous growth in organic sessions, usually very gradual, to the point of being barely noticeable. It is often helpful to evaluate organic traffic against past time periods, usually via a year-on-year graph, so that the value of your SEO efforts is more evident.
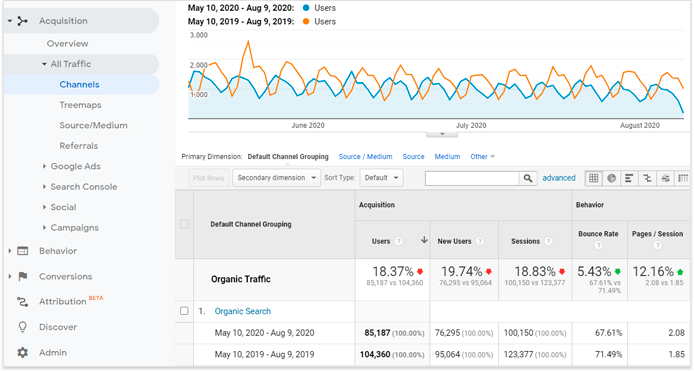
Keep in mind that as your website grows bigger, you are less likely to see meaningful fluctuations when viewing organic traffic for the entire website. That's when you'll have to focus on smaller segments of your website (blog, catalog, product, etc.) or even individual pages. Viewing their SEO traffic separately will tell you a much better story of what's happening to your search performance. This can be achieved by either creating custom segments or using filter options in Google Analytics.
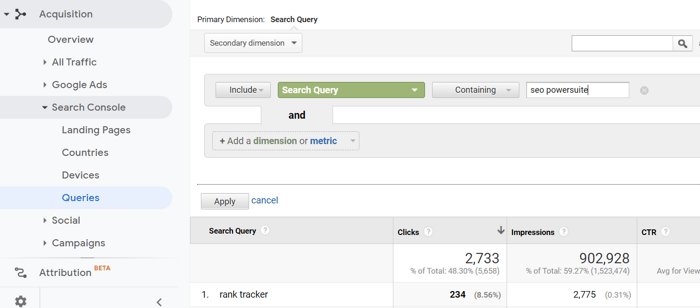
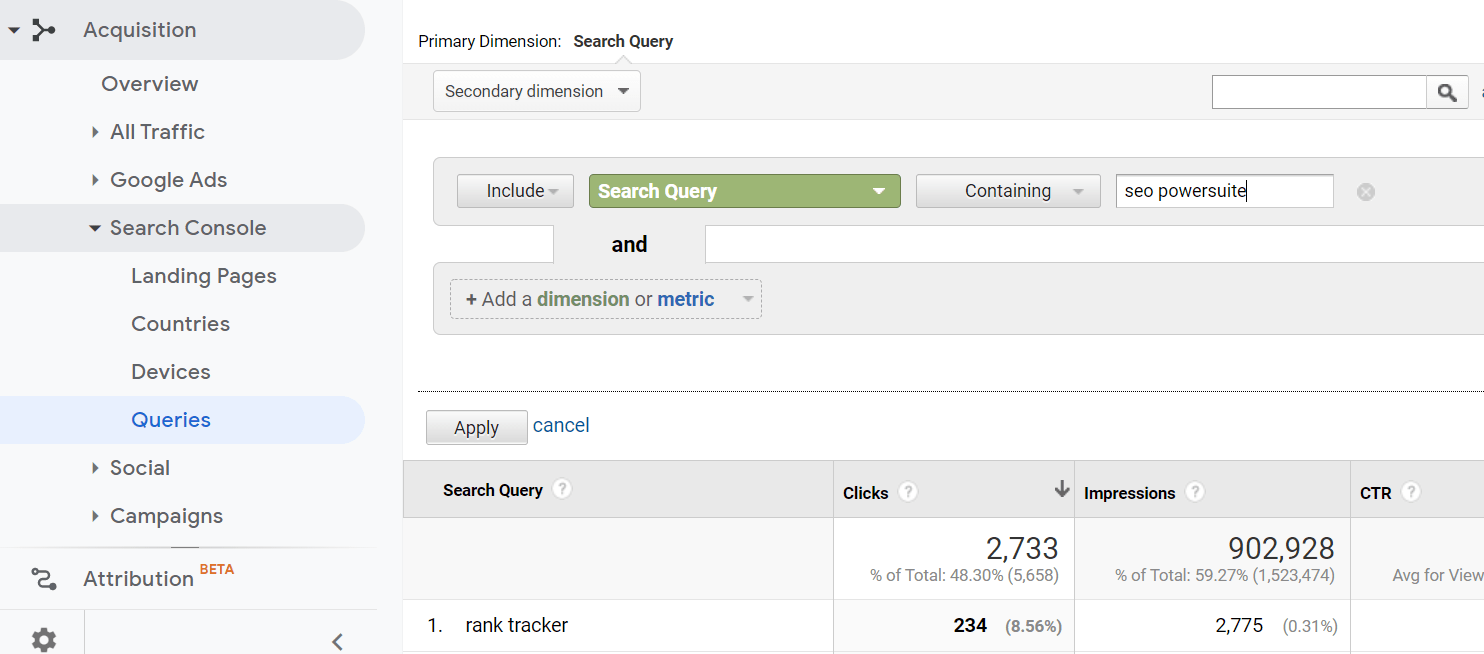
While focusing on individual queries, analyze your branded traffic. Branded SEO traffic is brought to you by ranking keywords that contain your company name. These searchers are your immediate customers, so branded traffic usually shows the highest conversion rate.
In addition to branded traffic, go to segment your organic search and review the commercial traffic, the one driven by keywords with an obvious purchase intent. Such queries include commercial words like ‘buy’, ‘order’, ‘for sale’.
Focusing on the commercial component in your organic search provides insights into how firmly your company stands in the commercial niche. Besides, commercial and branded traffic are just the right KPIs for marketers to track because they let you evaluate your total brand awareness.
According to John Mueller speaking about forthcoming updates in 2021, if people actively search for your brand, that’s a sign you are doing things right.
You can see all your branded queries, their impressions and clicks in Google Search Console. And if you connect your Search Console with Google Analytics (currently not GA4, though), you will have all these stats conveniently laid out there. So, to check your branded traffic in Google Analytics:
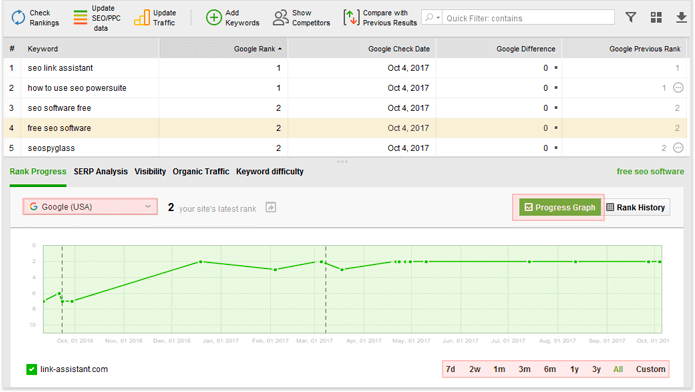
Keyword rankings are the positions that your pages occupy in search results for certain queries. The higher the positions, the more your pages are noticed in search, the more visitors you get. On top of that, SEO traffic is very sensitive to even the slightest shifts in keyword rankings. Moving just one position in either direction could mean thousands of users in gained or lost traffic. Track keyword rankings and react quickly to fluctuations — that is the key to your SEO success.
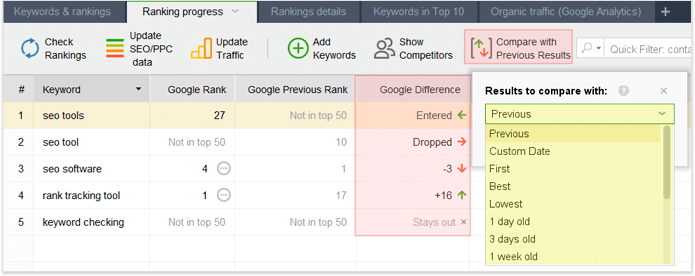
It is important to differentiate between what is called a Google dance and an actual drop in rankings. If you see a slight shift in rankings — wait up to a week to see if it's just a glitch. If the situation does not resolve on its own, then it's time to take a look at pages that have outranked you and borrow their optimization ideas.
A quick indicator for tracking SEO KPIs is online visibility showing how prominent your website is for your selection of key terms. Rank Tracker measures the total visibility score as well as the visibility of separate keywords. A declining visibility score is a signal you’ve got to pay extra attention to your keyword ranks.
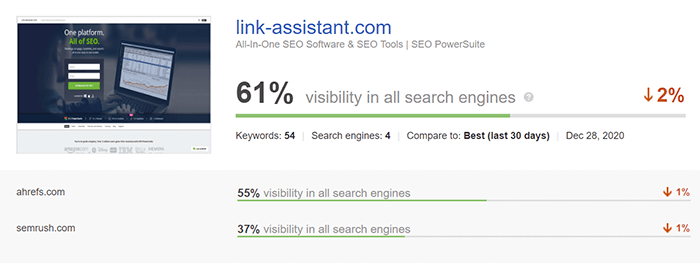
In Rank Tracker (a pro version), you can set an automatic task to generate a report on your ranks and online visibility. There are templates for automatic reports, though you can easily customize one to have your personalized templates. Add to compare ranks for different search engines, for desktop or mobile audience, whatever SEO metrics are more relevant to you. It's a great idea to benchmark against your main competitors’ domains as well.
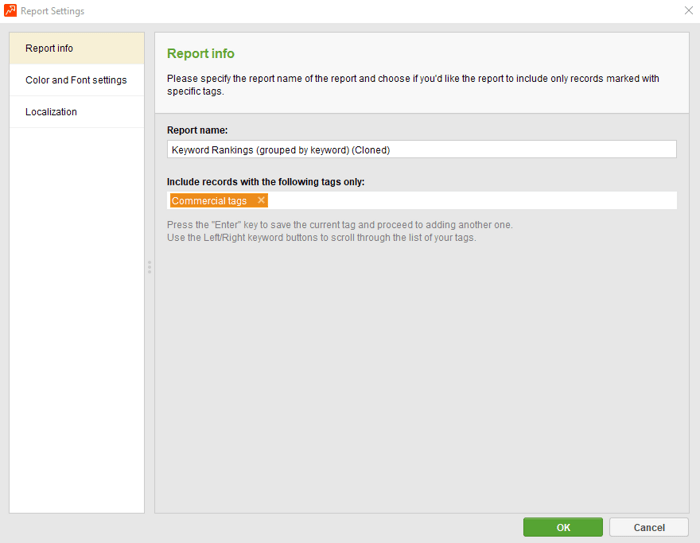
You can segment your keywords in the Rank Tracker dashboard with the help of tags. Add a tag marking a keyword as informational, navigational, commercial, or a branded keyword. When you set a task to deliver a report on your Keyword Rankings and Visibility, enter the editing mode and check the Settings of your template. Here, set to add only those keywords you want to track, filtered by their tags.
If you need some tips about how to investigate the intent in your keywords, refer to our keyword research guide.

Check the visibility report once a month or two, and you will not miss any critical situations. In all, the visibility score is good to measure the performance and SEO efforts at a glance to support or to refine your SEO strategy.
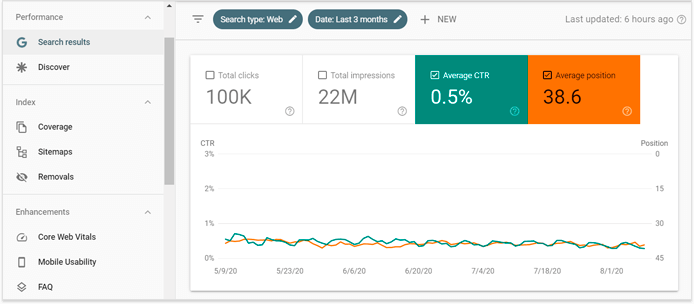
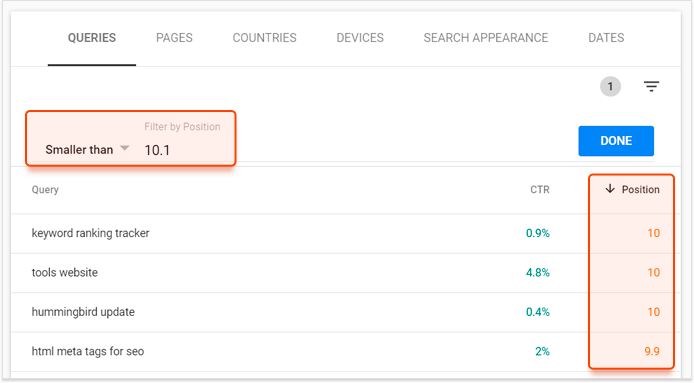
Impressions and clicks are the search performance metrics — they represent the number of times your pages appear in search results and the number of times they are actually clicked on. Together, these two metrics give you a click-through rate (CTR), basically a success rate of your pages in search. What you can do is benchmark your CTRs against the industry standard and learn which of your pages are underperforming relative to their SERP position.
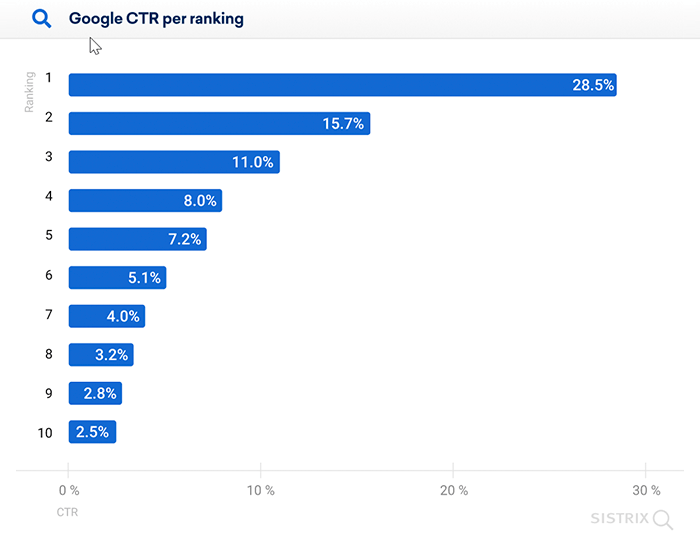
It’s pretty interesting that the CTR difference within a few top positions on the SERPs can be dramatic. Here is a study uncovering how the CTR distributes across the top 10 organic results. Remember, however, that this CTR distribution is relative: besides the position, one should consider the layout of the SERP. Depending on what you see at the top (a featured snippet, a sitelink, or any other rich feature), you might get a different click-through-rate across all positions of the result page.
Once you find a promising topic, go visit its SERP, and investigate the reason for poor click-through-rate. Sometimes the CTR is low because there are too many ads and/or knowledge panels stealing your clicks, in which case there is nothing you can do. Other times the CTR is low because your snippet is not attractive enough, in which case you have to optimize your title and description and look into using structured data to enhance your snippet.
Bounce rate, session depth, and session duration are all behavioral SEO metrics, i.e. metrics of user engagement. Whether behavioral metrics are ranking factors or not is one of the longest-standing debates in SEO, but I would like to argue that it doesn't matter. Behavioral metrics are still important indicators of page optimization and, as an SEO, you would do well to stack them in your favor.
All important SEO KPIs should be considered on a case-by-case basis. For example, the bounce rate measures how many people came to your page and did not engage with your site any further. A session is considered to be a bounce when a user views only one page, with a single request to the server (i.e., when the user loaded a page, probably read it, and then dropped off). In this scenario, a pageview has taken place, although, it is a bounce. If the page was meant for some single action, then even the bounce rate of 90% is quite okay. Thus, the purpose of any page as well as its acceptable bounce rate will vary greatly.
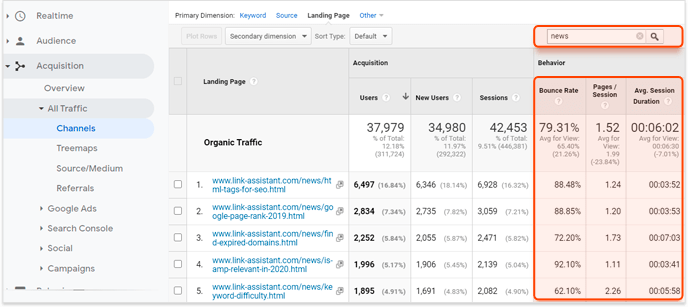
In the example above, I have added a filter to only view blog pages and I have sorted the table to show the most popular pages first. Immediately I can see that page number four has poor engagement compared to other blog pages. When I investigate, I realize that the article does not include any internal links, so the readers tend to quit rather than explore other parts of the website.
If you find some poor performers, then it would most likely be because one of these reasons:
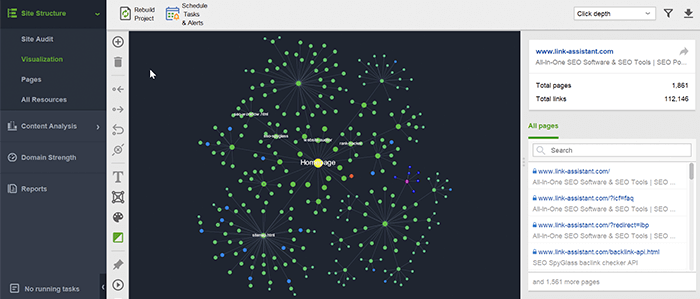
If you’ve found out that your bounce rate is too high, first review your internal links referring to other articles on your site. Sometimes, a high bounce rate is caused by poor on-site navigation. In this case, consider changing the site structure. Create a simple site structure, and it will be quicker and easier for people to find all your valuable content and for search engines to crawl it. It’s also no good when pages are buried too deep. SEOs recommend having each piece of content only a few clicks away from the homepage.
Use Website Auditor SEO crawler to review your site architecture and click depth, and rebuild your site structure if necessary.
Besides, analyze the main keywords you are targeting with that page and whether it satisfies the user internet in the query. Sometimes it does, the customers do the purchase or subscribe and leave, and that’s okay. But in fact, having a few follow-up links to explore more on your site should lower the bounce rate and save a bit of your SEO efforts.
One more important KPI to measure for performance optimization is the number of returning visitors to your site. As John Mueller emphasized once again: you need more of repeating visitors, which is all about building trust, authority and brand awareness.
Some recos from John for 2021: Look to reach a broader audience (diversify). Look to create repeat visitors. E.g. If people actively search for you, that's a sign you are doing things right. Also easier to rank if your brand is in the query... Build trust/awareness/authority. pic.twitter.com/G8aLC0qvzw
— Glenn Gabe (@glenngabe) December 8, 2020
Growing your permanent audience is important, it indicates that your site (and company) is able to establish a long-term relationship (yeap, because you’re cool! But also because you’ve succeeded to meet your target audience out there). The audience retention rate is a critical KPI for the media and bloggers because it indicates how deeply they engage with visitors, whether users like their site and find its content useful.
How to check
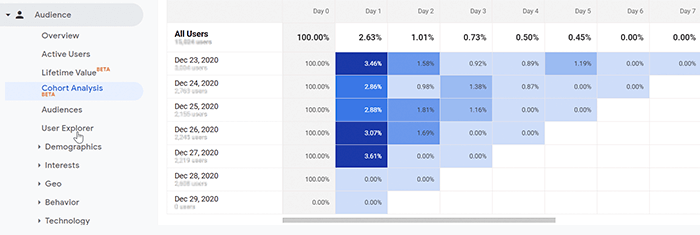
For a start, you can get a general overview of your new visitors and returning visitors in Google Analytics under the Audience > Overview tab. Here you will have the percentage of sessions performed by returning users, the number of pageviews per user, session duration and other important stats about your site audience.
You will have the breakdown by days, weeks or months, and the percentage of users that returned to your site. This way you can measure the most effective campaigns you’ve had and see where to improve.
A conversion is a completed activity that benefits your business. It can be virtually anything — a subscription, a download, a purchase, or any other action a user takes on your website. And a conversion rate is a share of these actions relative to the total number of visits.
It is essentially a two-way metric. On the one hand, you can use it to evaluate and optimize the design of your sales funnel. On the other hand, you can use it to evaluate the quality of organic traffic — see whether your SEO efforts attract relevant visitors who are actually interested in your product or service.
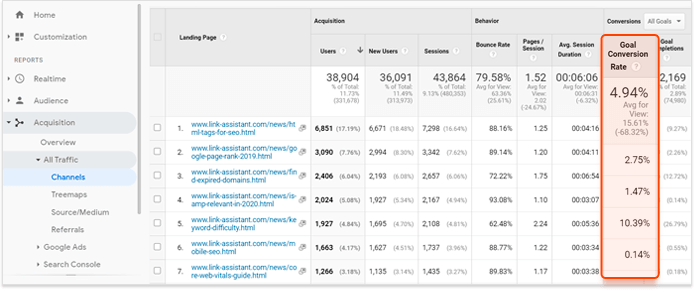
There are countless ways to view conversion rate data. Personally, I prefer filtering pages by type, e.g. blog posts, and comparing the conversion rates for similar pages. This way I can see which blog topics actually drive value for my website and which ones are just for fun.
There is a way to track leads and conversions for your SEO keywords by merging data from Google Search Console and Google Analytics. For SEO KPI examples showing how to track performance and evaluate SEO efforts, have a look at our guide for merging data in Google Data Studio.
Backlinks are a major ranking factor and a healthy backlink profile is crucial for gaining better search positions. Which is why you should always track backlink metrics — lose some good links, or gain some bad ones, and your rankings are going down.
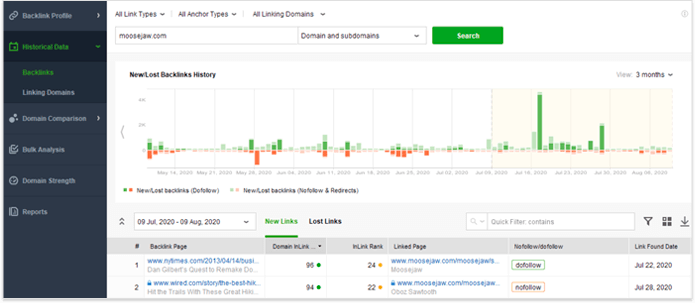
The point of monitoring your backlink profile is that you can perform timely damage control. If you suddenly lose some quality links — the sooner you contact the webmaster, the better your chances of recovering them. Similarly, if you gain some bad links — the sooner you disavow them, the smaller the chances of being penalized by Google.
Likewise, when deciding whether to bid or not on a certain keyword, you should analyze link building metrics of your competitors. When you seek to improve a keyword’s performance, you’ve got to consider the authority of your competitors — to know how much SEO efforts it will take to outrank them. Besides, the backlink profiles of your competitors can be a good link-building source: pick out a few relevant domains with high authority and reach out to them in an email, inviting them to explore your materials and quote.
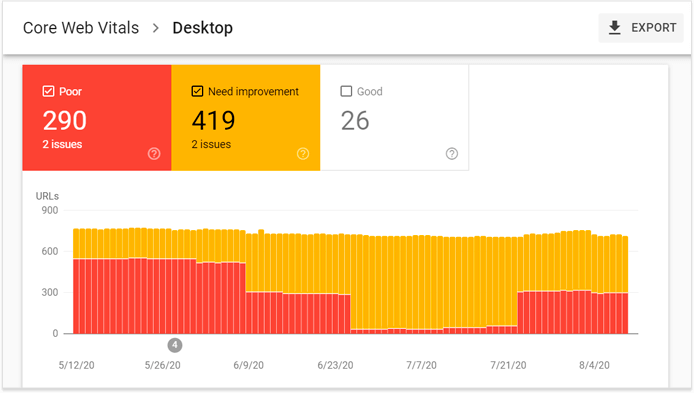
Core Web Vitals have recently been introduced by Google as the latest user experience metrics and possible ranking factors. For now, there are three 'vitals' and all of them are more or less about page speed, but Google has hinted at more UX metrics being added in the future.
Even though there are plenty of other technical SEO metrics out there, I believe that Core Web Vitals are the right KPIs to get on SEO dashboards because soon it will become the focal point of technical optimization.
Another source for Core Web Vitals insights is the Chrome UX Report on the basis of BigQuery and Data Studio visualizations. All you’ve got to do is link the raw CrUX data to Data Studio (here is a brief explanation on connectors and how to make it work). The user won’t need to create any queries or generate charts.
Just enter the site URL you want to check. (Currently, the dataset has over 4 million origins provided with the metrics. If yours is not present there, you will get an error message.) The schema page will show up with all necessary fields.
Hit Create Report, and a bunch of important metrics over the real user experience will be presented in a single convenient dashboard. Each metric is explained on the left, and the percentage of pages with this or that performance result appears to the right.
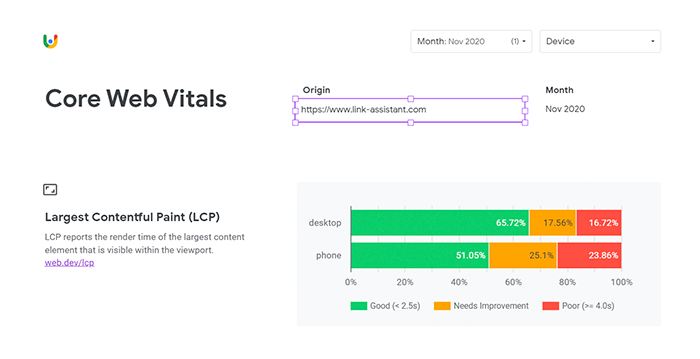
You can add and remove fields and filters to see a breakdown for desktop and mobile, or change the date range for analysis.
We still have time to work hard on site performance by the time the Web Core Vitals update is over (which is expected to happen by the end of March, 2021). Without proper performance optimization, your site will stay in the backyard of Google searches. So, make sure to improve the most important metrics as regards to the load speed and UX. You should have most of your pages (ideally all your pages) showing the best result.
As a few best practices, remove intrusive pop-ups (that might be increasing your bounce rate) and forget huge files (that might be increasing your load time).
Last, but not least. SEO ROI tells you whether you are actually breaking even on your SEO efforts. Calculating SEO ROI is a very nuanced process and the main difficulty is that search engine optimization is a long-term investment. Each optimization you make, each piece of content you produce has the potential to deliver benefits for years to come. So, naturally, making a connection between the resulting benefits and the investments they originate from is a bit of a challenge.
Search engine optimization may often feel like a black box. You optimize for a bunch of ranking factors and you hope to get a bunch of traffic in return. Hopefully, the SEO KPIs above will help you expose some of the mechanisms of the black box and will allow you to apply search optimization where it's needed most. And, in case I've missed any of your favorite SEO metrics, don't hesitate to let me know in the comments below.