23348
•
26-minute read

“Universal Analytics will no longer process new data in standard properties beginning July 1, 2023. Prepare now by setting up and switching over to a Google Analytics 4 property.”
I bet this notice in your GA tool has already annoyed you a little. Ever wondered why on earth should you ever switch to Google Analytics 4? Then this article is for you.
Getting used to the new Analytics, I wanted to spot some benefits of Google Analytics 4 and figure out how to use it for SEO together with SEO tools in a new way. Since all the information may seem overwhelming, it’s split into Q&As, with an overview of the main differences between UA and GA4. Enjoy!
Google Analytics 4 is a web analytics service to measure traffic, conversions, and user behavior across websites and apps. The old version of analytics from Google, known as Universal Analytics, has been in use since 2005. Almost two years ago, Google announced its plans to sunset Universal Analytics and invited its users to switch to Google Analytics 4.
Google Analytics 4 was released in October 2020 and is now offered to set up by default for all new setups on websites. However, you still can set up Universal Analytics, or run them both in parallel.
After July 2023, Universal Analytics will stop processing new hits (for paid Analytics 360, the deadline is October 2023). The data from old Analytics should stay for at least six months onward. So, finally, Google Analytics 4 will replace Universal Analytics.
So far, you can run both Analytics simultaneously. Mind that connecting to Google Analytics 4 does not transfer all your existing data from Universal Analytics automatically. Since Google Analytics 4 has just set off, some stats (or what you expect there to be) might be missing.
So, definitely, yes, you should switch to GA4 the sooner the better so it can start collecting historical data. In a year, you’ll be able to compare the old and new Analytics reports year-over-year.
GA4 is still in development, and many users agree it is not yet up to par with Universal Analytics. Although the beta product label has been removed, GA4 interface and functionalities are somewhat changing from time to time. For example, not long ago, Google added the conversion migration tool to import goals from Universal Analytics.
Google has made several major improvements with GA4, which roughly boils down to three reasons behind the innovations:
Nowadays, hardly anyone uses a single device or platform, be it work, shopping, or leisure. A typical example is when you saw something in a video on YouTube, stumbled on an Instagram ad, Googled it from your smartphone, and the next day finally added this thing to a shopping cart from a work laptop. How can the online shop find out which channel brought them this purchase?
So, the ultimate issue resolved in GA4 is understanding complex, multi-platform customer journeys.
Google offers a new approach to collecting user information through the so-called Google Signals. Google Signals is the data of authenticated users who have agreed to Ads Personalization. The signals allow website analytics to de-duplicate users and provide a more unified, “holistic view of how those users interact”.
For example, you may search for some information from a mobile device anonymously, then repeat the same search from a laptop logged into your Google account. Google uses three types of identities to stitch all the information together: user ID, Google Signals, and device ID.

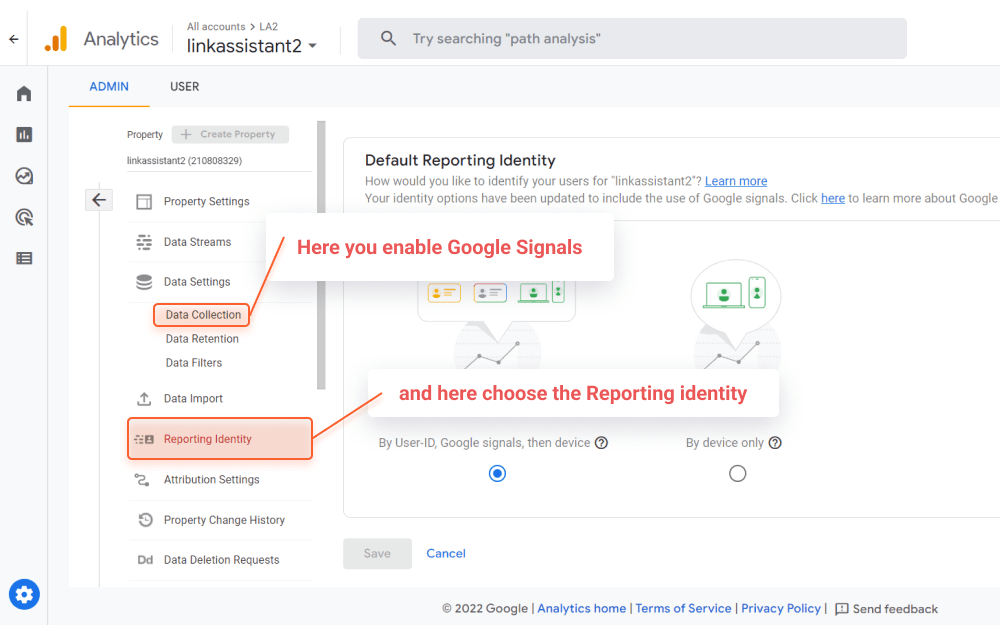
When deploying analytics property, make sure to enable the collection of Google Signals in the Data Collection settings. You can also choose the reporting identity, i.e., by which type of identifier to track your data — by user ID, Google Signals, then device ID, or by device only.
In recent years, data protection has become a major concern for netizens and tech corporations. No wonder, taken modern tracking capabilities, and how much some people object to being tracked. The page X-ray below is an example of how many tracking codes can be triggered upon one single pageview.
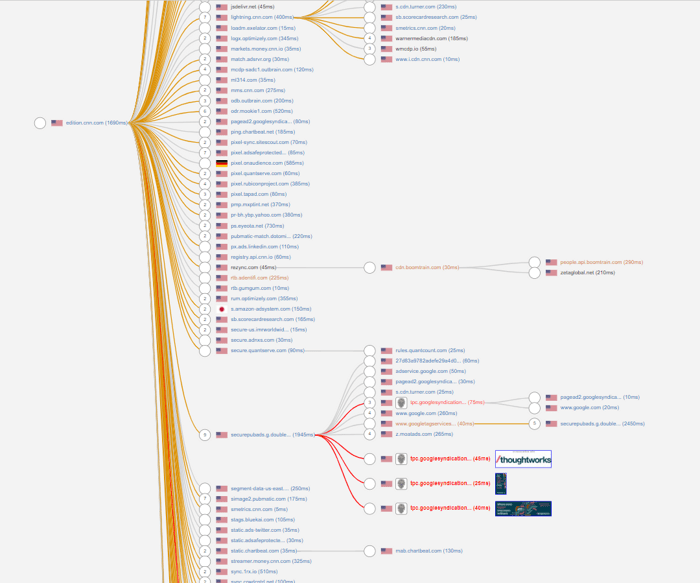
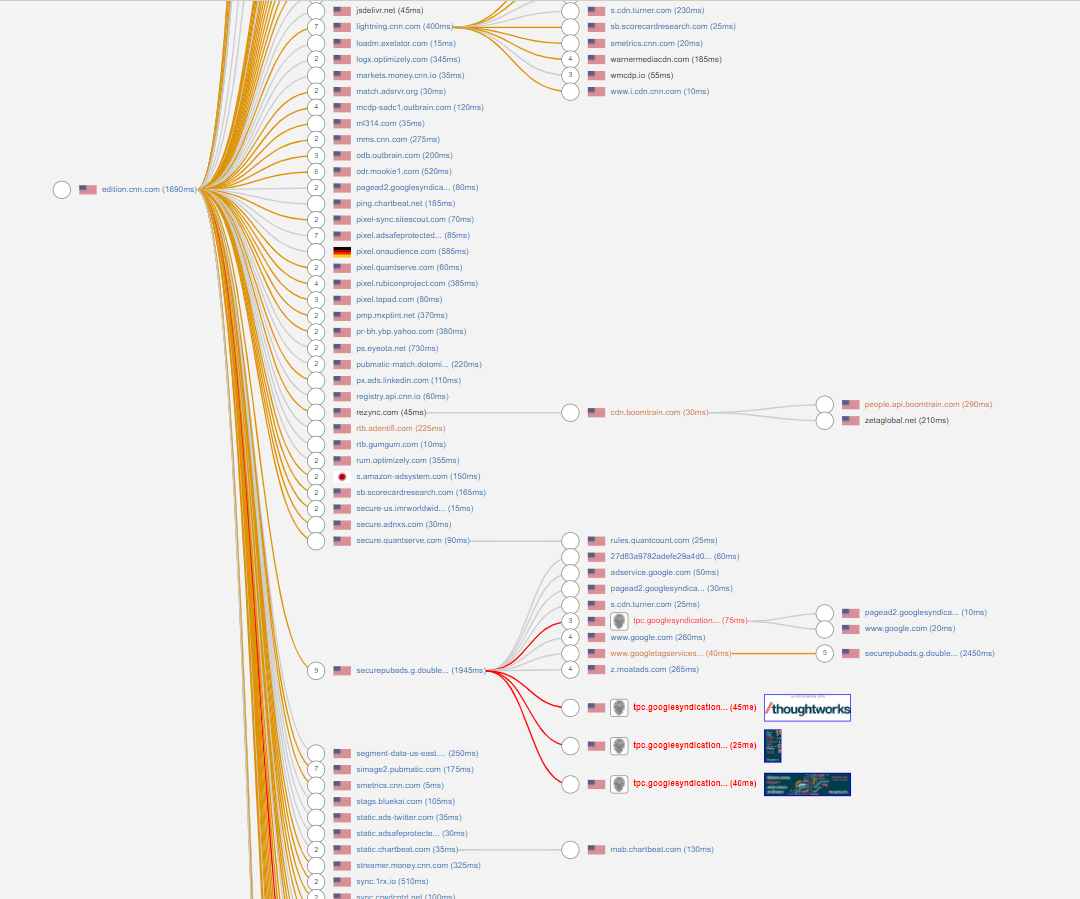
It is believed that these are privacy concerns pushing Google towards its new Analytics.
Firstly, Google is diminishing its reliance on cookies. Instead, it tries to use machine learning to fill in the gaps where users don’t give their consent to data tracking.
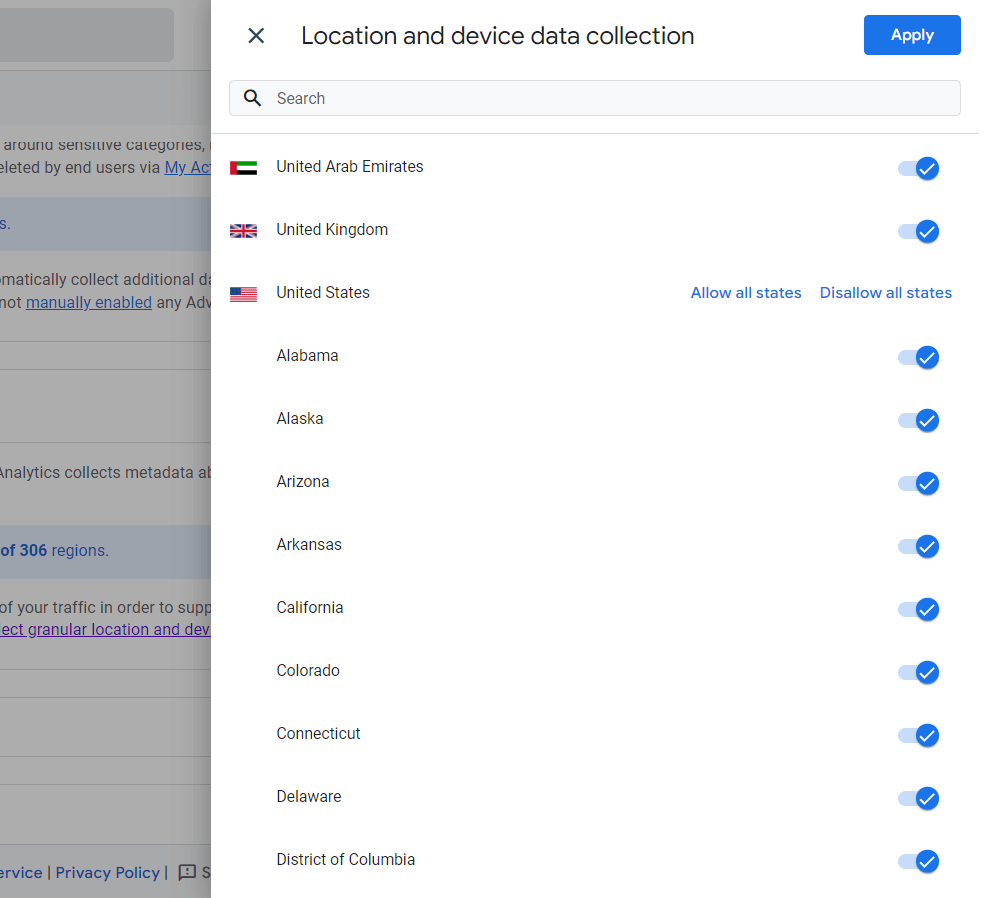
Secondly, data protection standards vary across regions and countries. Mind that you cannot track, store, or process some types of information without users clearly giving their consent. Particularly this refers to PII data (personally identifiable information) such as name, contact details, ID card, etc., something that can identify a real person.
Thus, Google offers granular data controls to define how information will be collected at a local level. And GA4 consent mode allows you to adjust how your Google tags behave based on the consent from your users.

Businesses aggregate tons of information, but the question remains as to how to translate it all into something meaningful. Google offers automated insights to help users make sense of the collected data and keep up with the changing ecosystem.
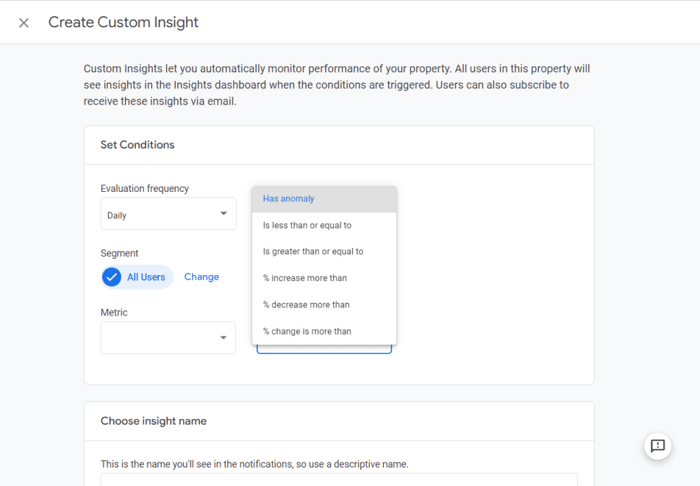
Google has Analytics Intelligence Anomaly Detection to find anomalies. Its machine-learning algorithm uses historic data to train its forecasting model: 90 days for the detection of daily anomalies and 32 weeks for the detection of weekly anomalies.
Once your Analytics collects enough historic data, it can show you emerging trends and unusual changes: spikes or drops in users, changes in traffic sources, soaring revenues, etc. The insights can be automatic or custom ones, set according to your preferences.

If you don’t have a website or want to try GA4 before starting your account migration, here is a demo account of a Google Merchandise Store to test all features.
Universal Analytics is a freemium tool. Website owners can run it free of charge, but there is also a paid version called Analytics 360, with enhanced functionalities that benefit large enterprises.
Similarly, Google offers a free basic version of Google Analytics 4 and a premium version for large enterprises. There is both good and bad news about what Google has to offer for free and for money, and we’ll dwell on these in a few paragraphs below.
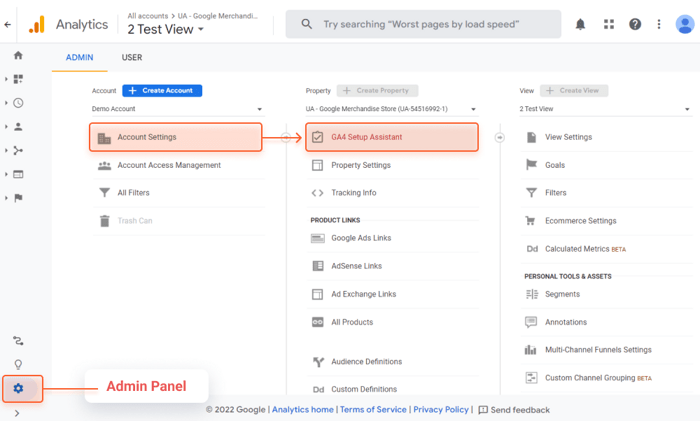
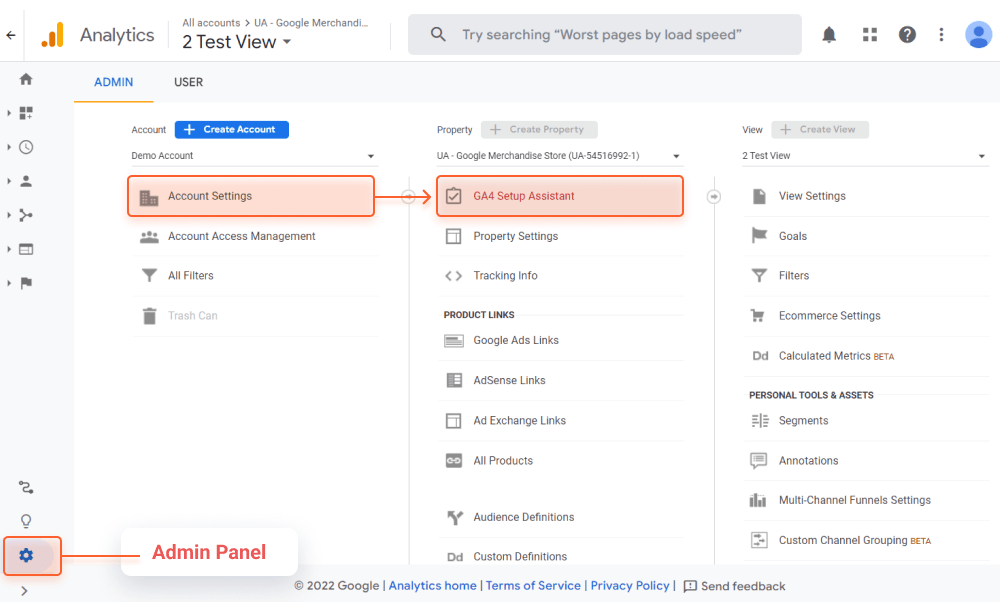
To set up a new property for GA4, in your Admin box proceed to the Google Analytics 4 setup assistant.
Then you’ll need to click Get started under ‘I want to create a new Google Analytics 4 property’, define the website, and add the ID for your analytics property.
After that, you need to install the tracking code on your site, manually or with the help of Google Tag Manager.
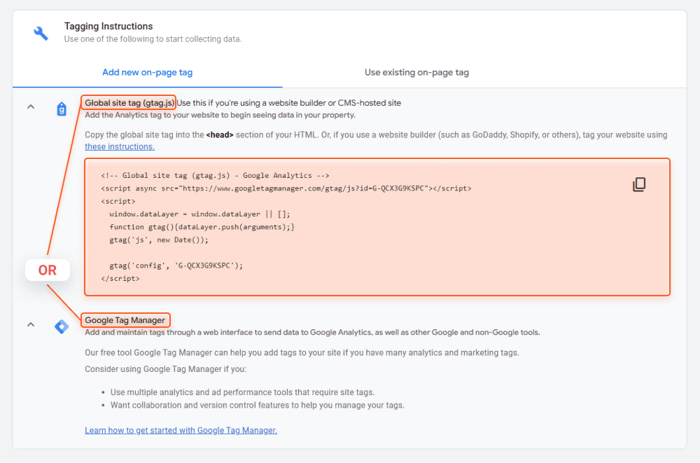

Manual Google Analytics 4 implementation will require some coding skills. As for Google Tag Manager, you will need to install Tag Manager on your site, and it will then act as an interface giving instructions on what events and conversions to track on your site. Here is a nice tutorial about setting up GA4 and Google Tag Manager.
First off, be ready that your data between UA and GA4 will not match, but it should be somewhat close. You might be missing some filters in GA4 that exist in UA, and lots of data fields and reports will be empty at the start.
When you first log into Google Analytics 4, you will see familiar UI colors and some sections.
However, GA4’s major functionalities are essentially different from what we’ve been used to over the past decade. The biggest difference between Universal Analytics and Google Analytics 4 is the measurement model used.
Universal Analytics uses a measurement model based on sessions and pageviews. Contrary to that, GA4 is more focused on users rather than sessions. GA4 creates a single user journey from all the data that is associated with the same user ID.
I suggest taking a short journey through Google Analytics 4, comparing some features side by side.
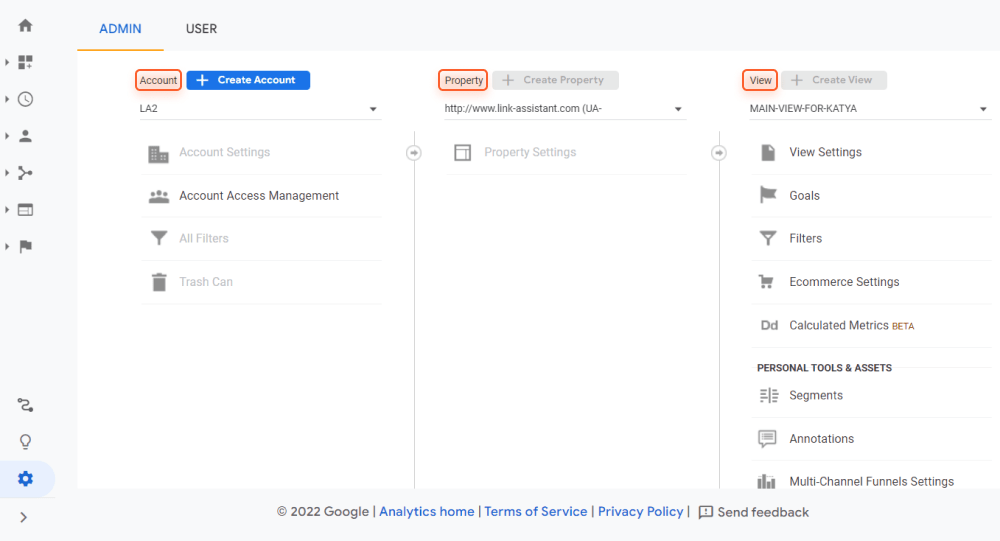
First of all, there is no way to create filtered Views in GA4. Universal Analytics has three admin levels, Account, Property, and View, whereas GA4 only has Account and Property levels.

vs
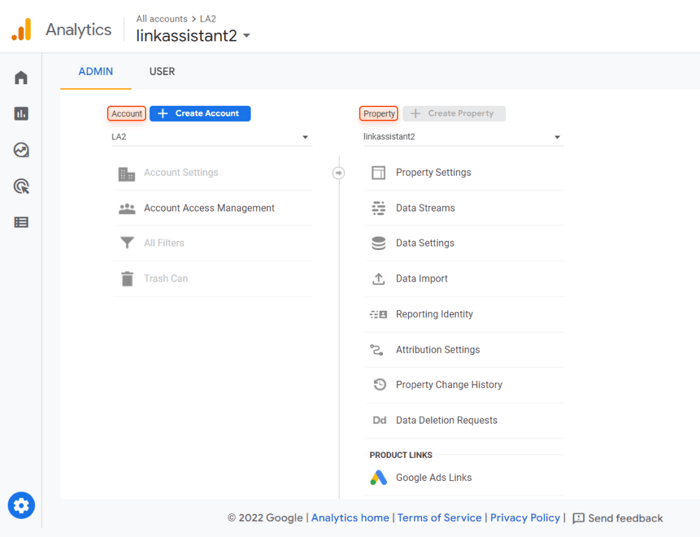

This is the main challenge that users are grudging about: the possibility to create views with filters allows sharing the required set of data with another user. For example, in Universal Analytics, you can filter regional data of your local traffic, with local currency and timezone, and send an overview to a client.
In Universal Analytics, each website has a different property, i.e. associated ID through which the tracking is performed. To collect data across all platforms, you can create a roll-up property in Analytics 360.
For example, you run three different domains, each is a different property, but they all belong to one enterprise. And you want to report on them all together in one report. This is where you can use the roll-up property in UA.
Besides, for mobile and app development, you had to use Analytics SDK-based reports or integrate Google Analytics to the Firebase platform for tracking installs, behavior, etc.
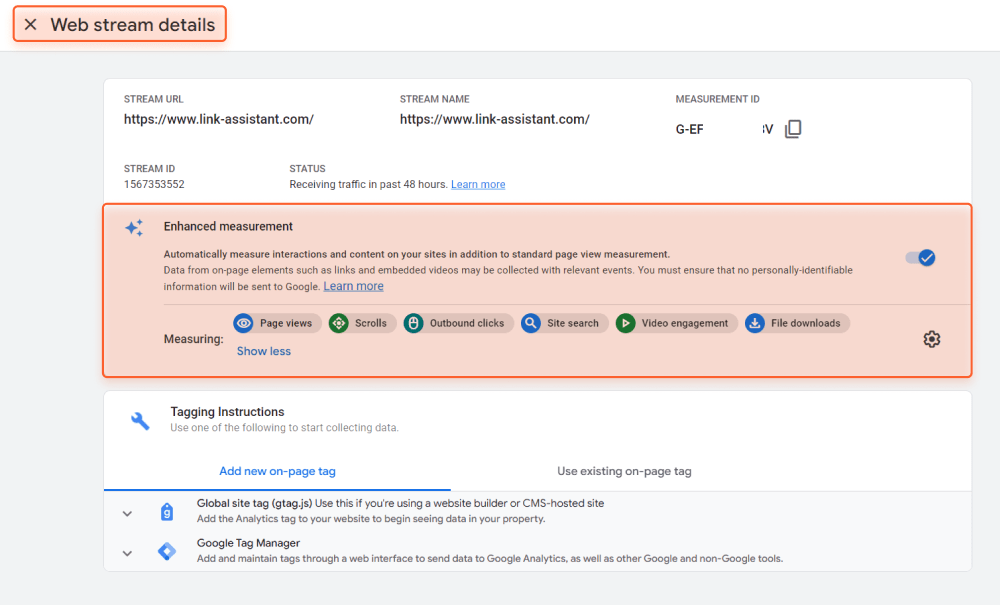
In GA4, a property can be a website, an app, or both. Instead of Views, Google Analytics 4 features Data Streams, which are the data sources inside a property. When setting up your GA4 property, you define Data Streams that will source the feed.
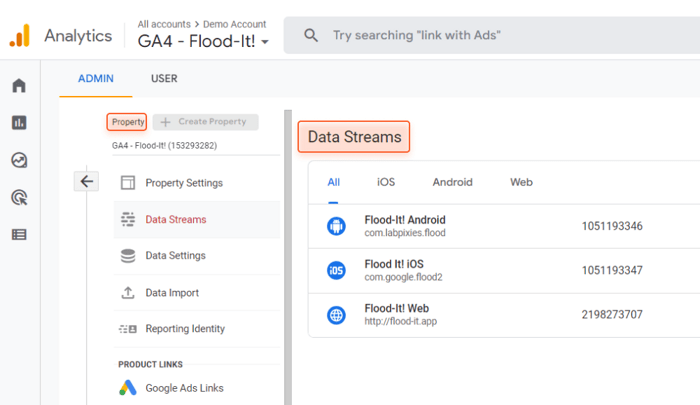
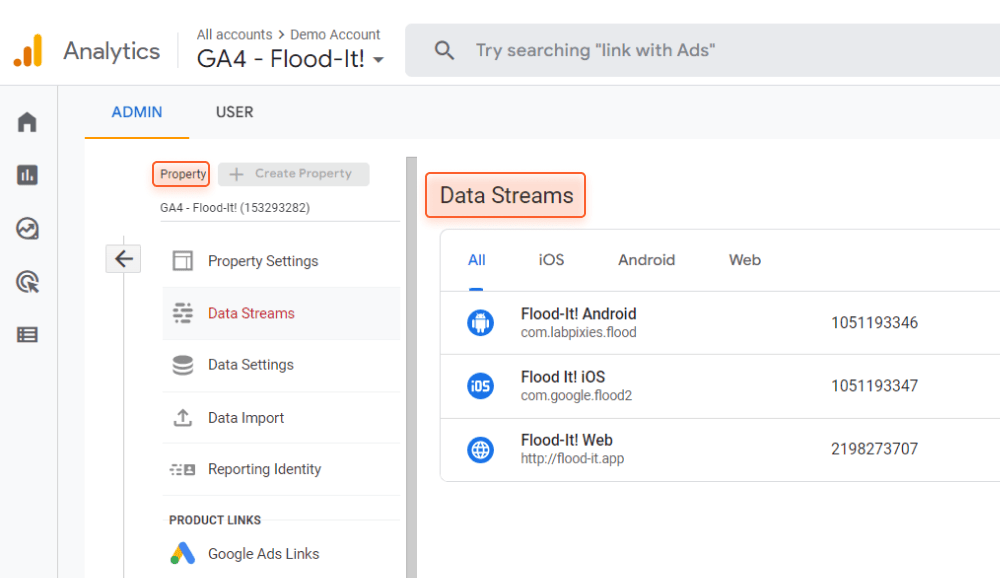
Thus, adding multiple data streams in a property now acts like a roll-up property in Universal Analytics 360. This is helpful for unified cross-platform data tracking. Now you can have your data on a website and app combined in one report. Besides, an advantage of Data Streams is that they’re automatically configured to track some important metrics relevant to the platform.
However, there are certain things to consider when you’re deciding whether to break data into streams or different properties. There are limits on the number of custom dimensions per property in the basic GA4 version. For example, you can have 50 event-scoped dimensions, 25 user-scoped custom dimensions, and 50 metrics per property.
Besides, some settings like reporting category, time zone, and currency will be property-wide, as there is no view-level filtering. Users will have access to all data streams inside the property. For integrations, for example, with BigQuery, all your data from the property will turn up in the dataset of BigQuery. So, if you manage multiple domains and apps, think about how you’re going to structure your GA4 account.
GA4 allows adding subproperties, which are the subsets of data taken from a property. A subproperty is created to govern data and user access. For example, for a global brand with regional branches, you can create a regional set of data to access. You cannot create events of its own, only take a subset of data from an existing property.
The benefit of subproperties is that everything happens on the server side. So you won’t have to add any additional tags or pieces of code. Adding subproperties is only available in Analytics 360 at additional costs and only for enterprises that are linked to Google Marketing Platform.
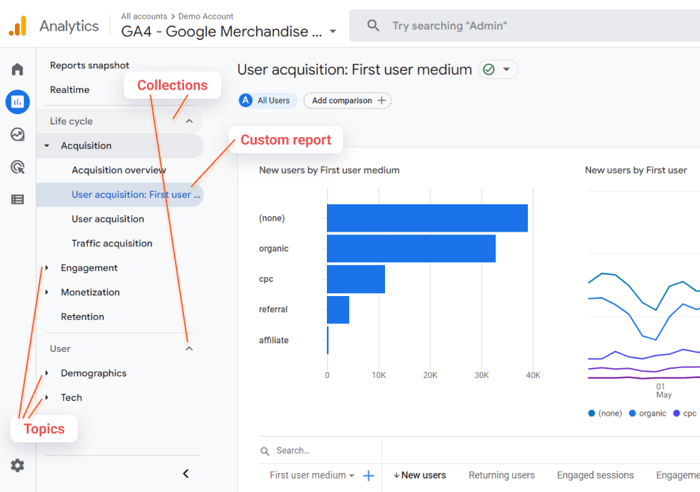
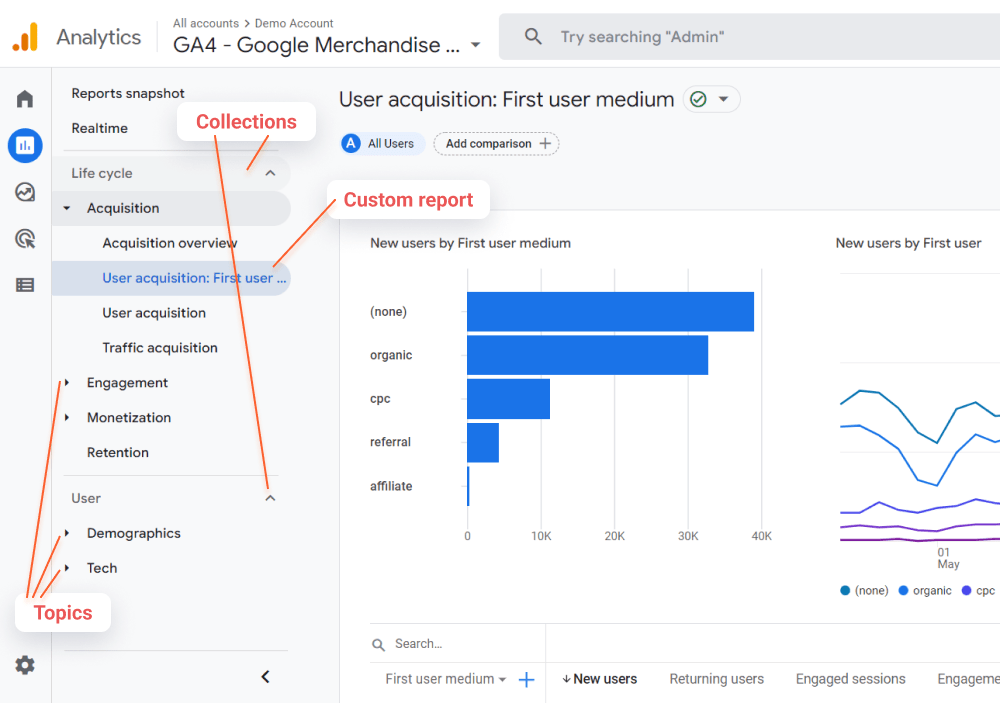
Reporting in Google Analytics 4 may look like a bit of a challenge from the start. First, the Customization section for saved custom reports is missing in GA4. Second, default reports have somewhat changed. However, you don’t need to panic.
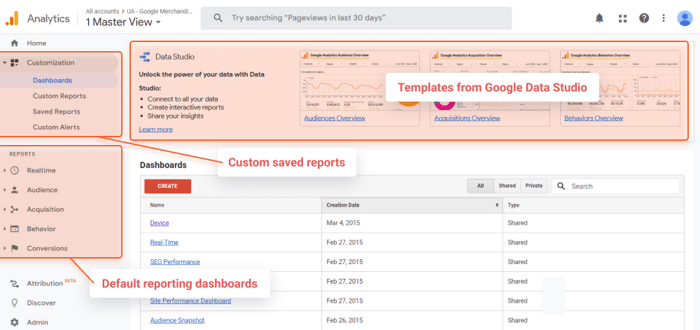

In GA4, you also have the default Reports section with familiar collections. The reports are all customizable, the report builder will be accessible in the top right corner (check if you have the right access level for that, Editor or Admin or None it was in my example).
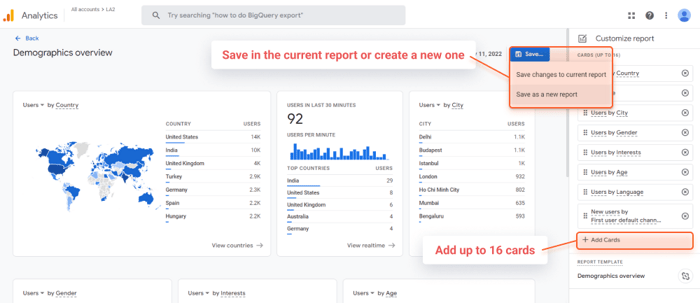

The reports can be grouped into collections. There are two predefined collections called Lifecycle and User, with topics unwrapped with the down arrow, and reports inside them.
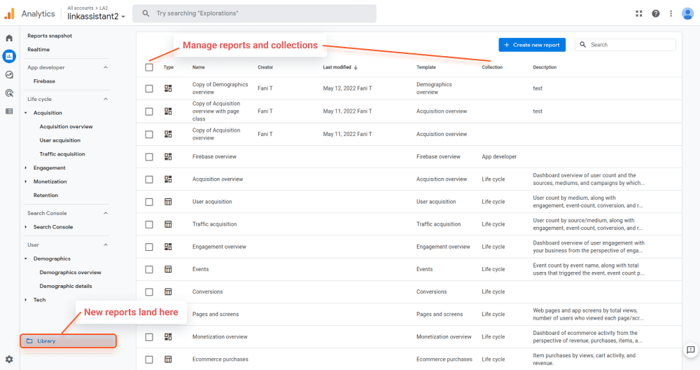
There is a 200 custom reports limit per property. Mind that you will need an administrator access level to manage the reports in the Library where they are saved.

If you want more reporting opportunities, use the Explore section. There you will have templates for data analysis. There are various reporting Techniques, such as Funnel exploration, Segment overlap, Cohort analysis, User lifetime, etc. You can add several exploration reports in the workspace.
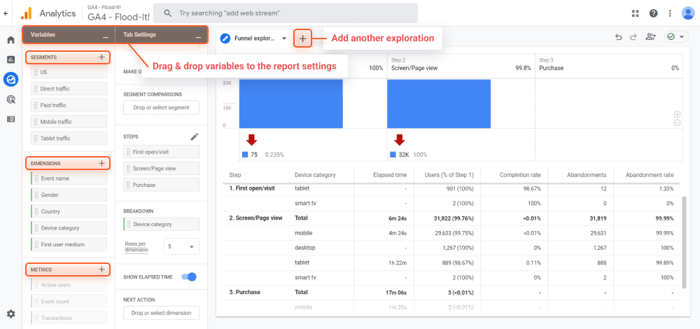

In the Tab Settings, you define what to see in your exploration. The interface of GA4 allows you to build an exploration by adding Variables with the help of the drag-and-drop constructor.
You can apply audience segments, for example, filter out mobile or paid traffic, or create your custom audience segment. And you can dig deeper into the data sliced by dimensions and metrics. Besides, you can apply filters and hover over charts to highlight some particular slice of data.
The reports can be saved to a spreadsheet or a PDF (though the look of it leaves much to be desired) and shared with a colleague via a link (permissions required).
GA4 is praised for a crazy number of integrations that previously have been available only to enterprise users.
In addition to Search Console and Google Ads, there are also integrations to Display & Video 360 Links and Search Ads 360 Links that have been available for paid users in Universal Analytics.
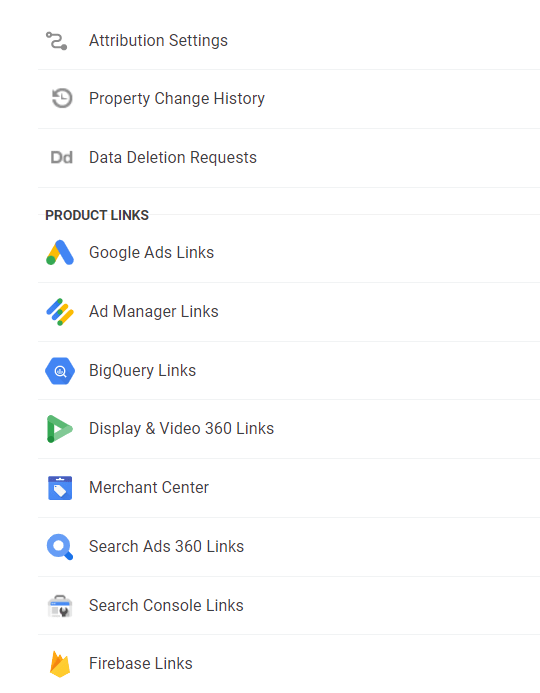
The highly welcome integration is BigQuery, the data warehouse to export data. This lets SEO and marketing agencies create custom tables, combining stats from different sources for further reporting, statistical modeling, etc.
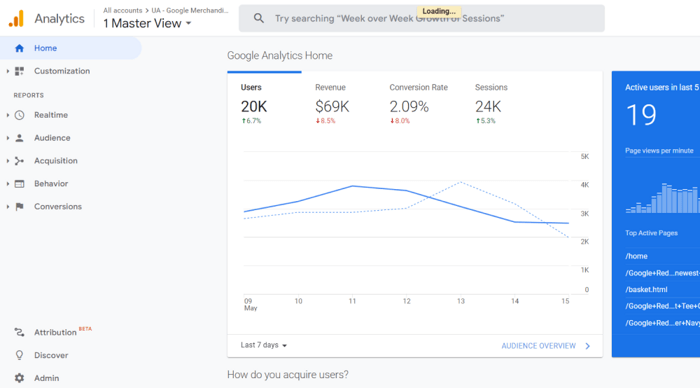
Homepage in Universal Analytics shows us the summary of how the website performs, with a dashboard of active users. You can have a quick overview of traffic sources, a bit of user retention, and conversions. You can switch to different time ranges to compare changes in trends.

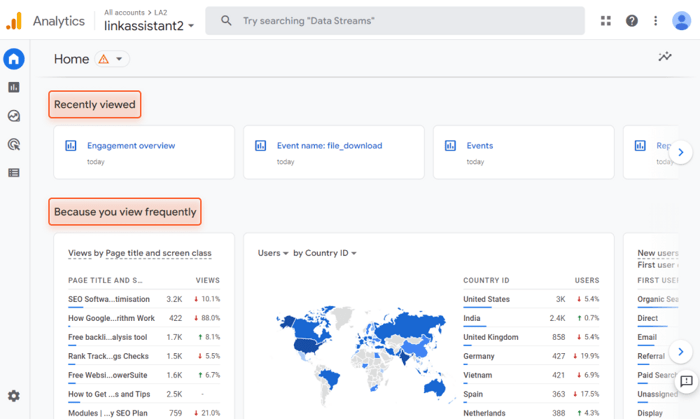
Homepage in Google Analytics 4 is somewhat different, adapted to your behavior in the tool. It will show your Recently viewed sections, as well as the Insights below.

Probably, you’ve already consulted the Insights inside your Universal Analytics for quite a while. In UA, you can reach Google Analytics Intelligence by pressing the Insights button in the right top corner, which unfolds the bar with the main insights.
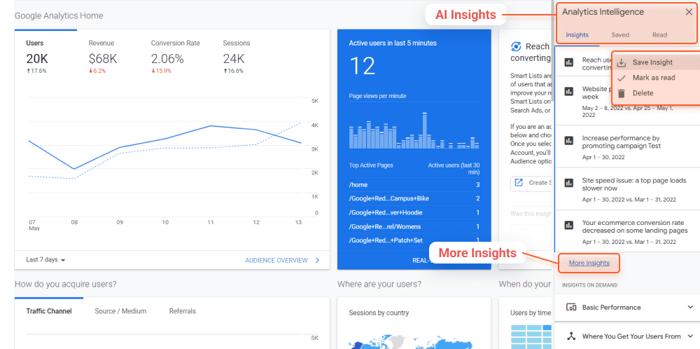

By unfolding the More Insights menu, you will see the top questions, formulated according to your top detected anomalies and important trends. You can mark each insight as read, delete, or save it for later.
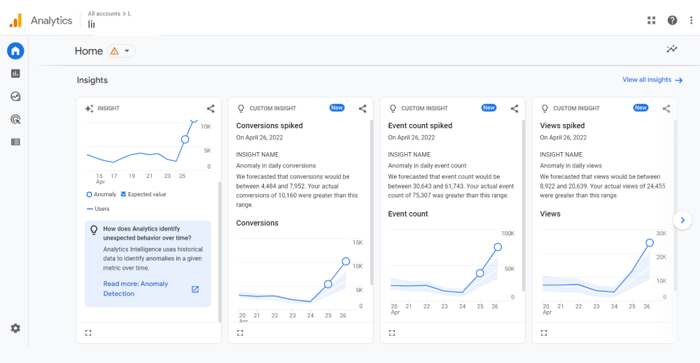

In the new GA4, you can find insights on the Home screen. If you have just connected the GA4 property, the Insights field will be empty. Your first insights will appear as soon as the tool collects enough historic data.
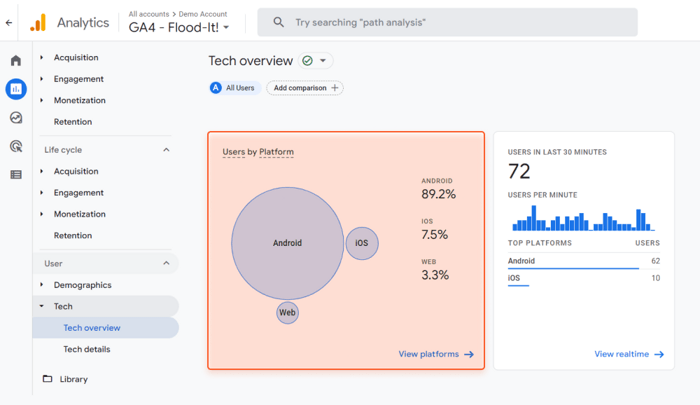
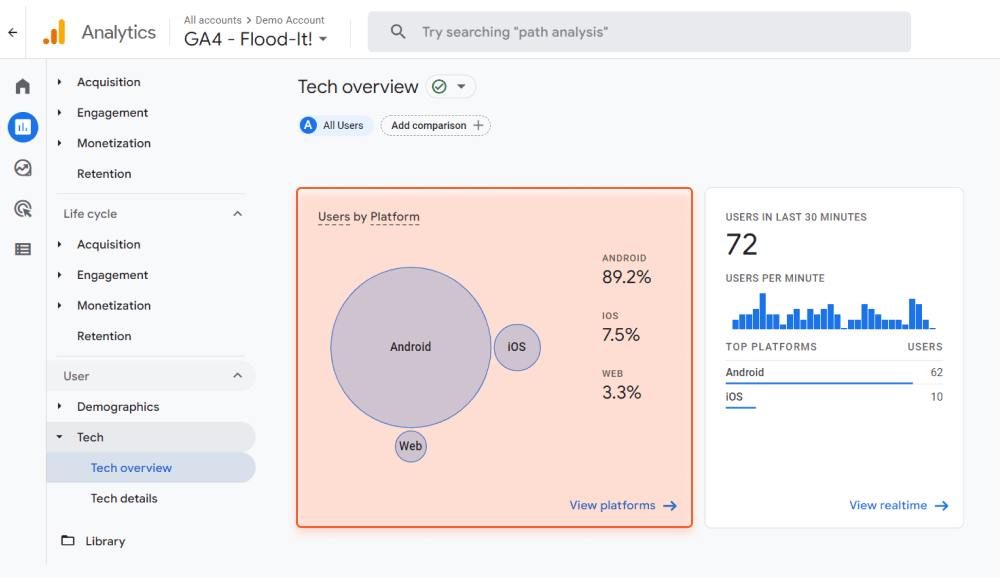
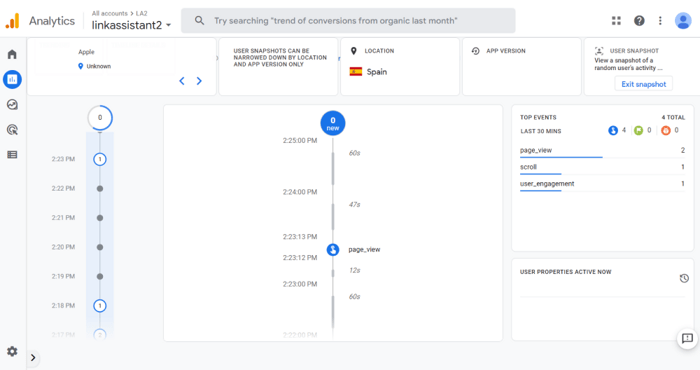
The Realtime report shows an overview of what’s happening on the pages right at the moment. This place helps you monitor some changes instantly or spot burning issues.
The first thing that catches the eye is that the counter of active users in the main dashboard is not the same in UA and GA4. The Realtime report in UA shows the actual number of active users in the last five minutes, whereas GA4 covers the span of the last 30 minutes.

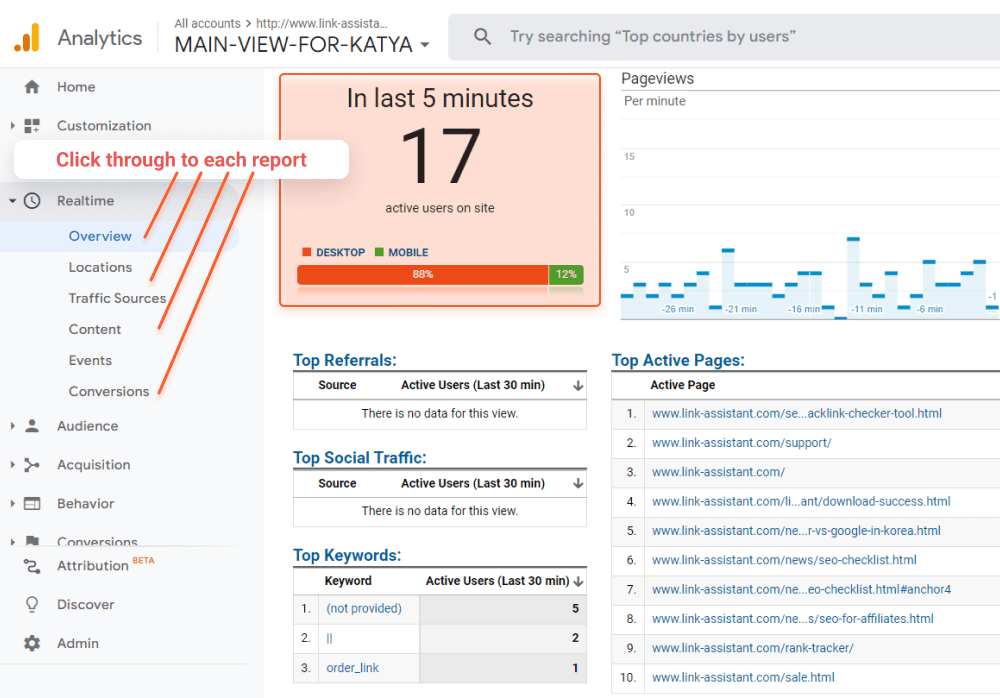
In Universal Analytics, you can click through various subsections of the Realtime report to see Locations, Traffic Sources, Content, Events, and Conversions.
In GA4, the Realtime report looks a bit more interactive. Below the map, there are various cards, e.g. Users by First user source, Views by Page title, Event count, Conversions. You can drill down further, changing some dimensions or creating comparisons to explore them by Source/Medium, Events, Audience, Conversions, and Views.

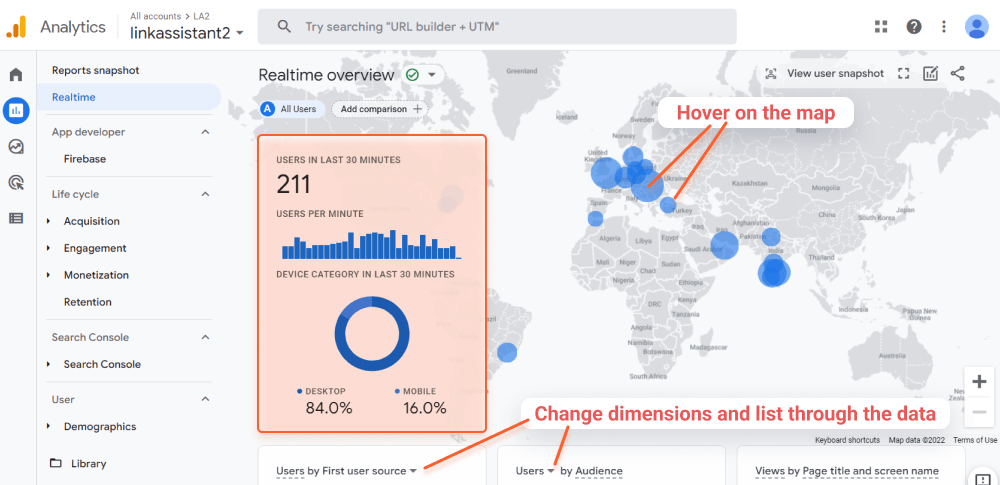
Besides, in GA4, you can proceed to the User Snapshot and see how a random visitor interacts with a page, with every interaction counted.

Google Analytics 4 was introduced as an event-based analytics platform. If you’ve been using Universal Analytics, then you’ve certainly configured some events to track important actions. But there is a difference between how events are set up and tracked in the two versions of Analytics.
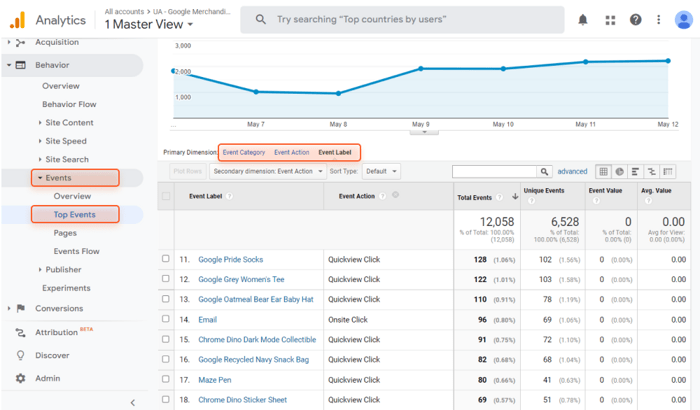
Events in Universal Analytics are hit-based interactions on your website within a session that you set up to track. For example, this can be a pageview (tracked in UA by default) and a click on a button, a form completion, a video play, or a click on an outbound link.
What you track as an event is recorded in Analytics as a parameter, configured with the following descriptors: category, action, label, and value (the two first are mandatory). One unit of descriptors with parameters sent to Analytics is a hit.
You can review the events set up in your Universal Analytics in Behavior > Events section.

Unlike in UA, in GA4 you can track as an event practically anything you’d want. GA4 allows adding up to 25 parameters to a custom event to track, in addition to those tracked automatically.

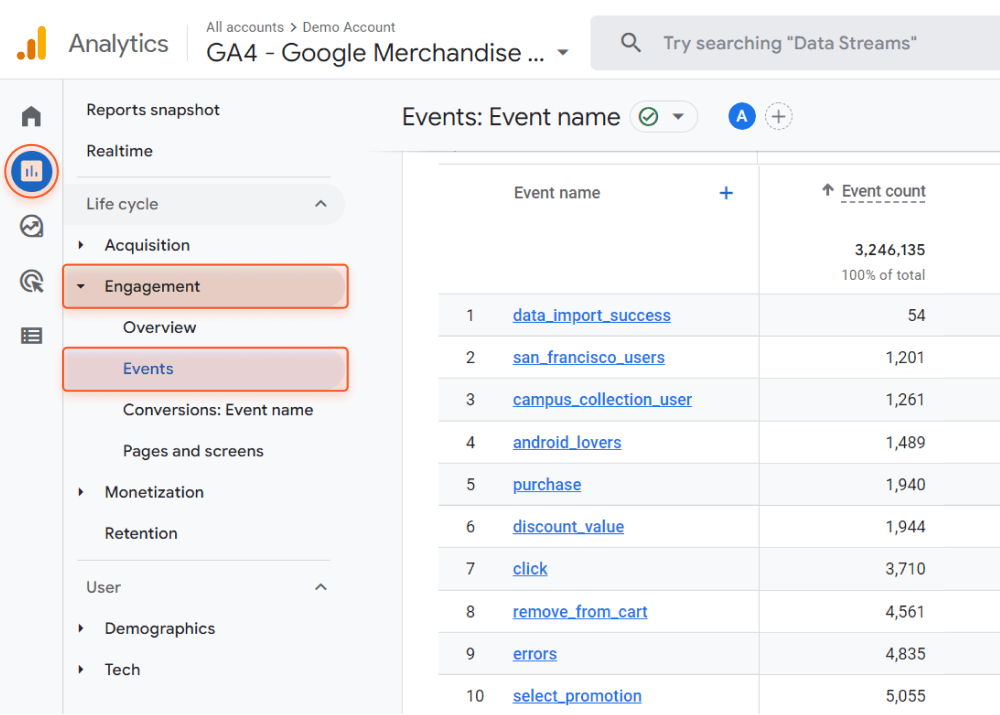
First, before migrating your events from UA to GA4, you need to revise what you already have. Probably, you won’t need to create any event for your measurements because the data is already tracked by default.
Note that as soon as you set up your GA4 property, it starts tracking pageviews, sessions start, scrolls, and some more. For this, you need to have the Enhanced Measurements button enabled in the Admin settings > Data Streams.

Second, before implementing new events, check out Google’s recommendations on what parameters you should better track for digital marketing purposes.
In Universal Analytics, we have hit-based Goals to measure conversions, and we have to deal with certain limitations. There are only 20 goals per reporting view. Besides, we can not delete or modify them essentially if we want to reuse them.

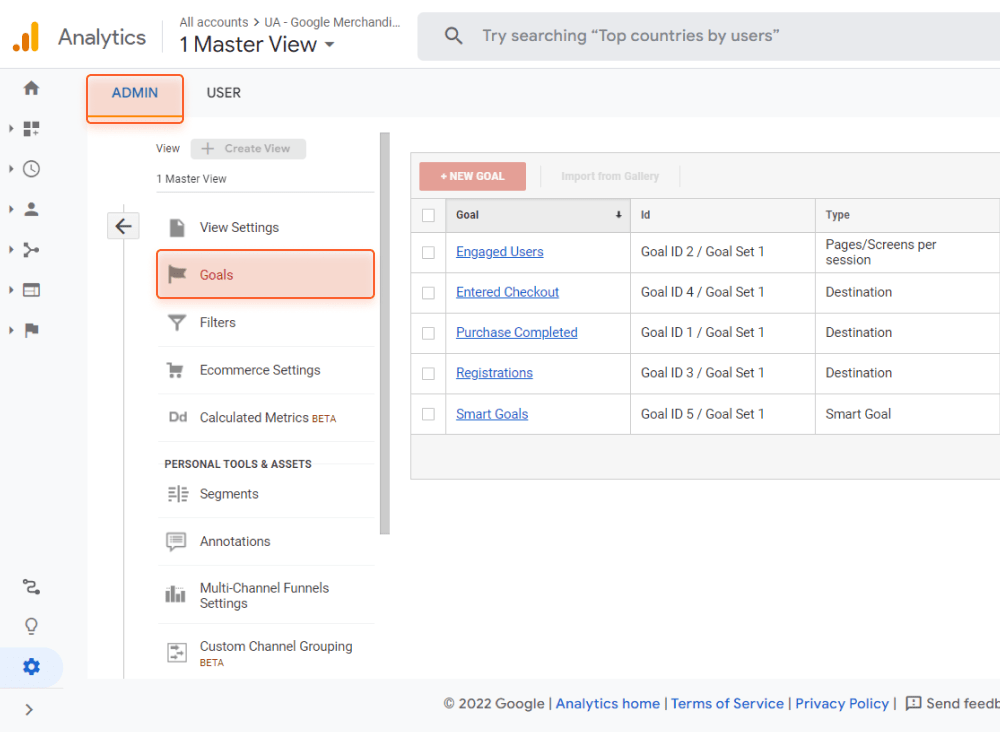
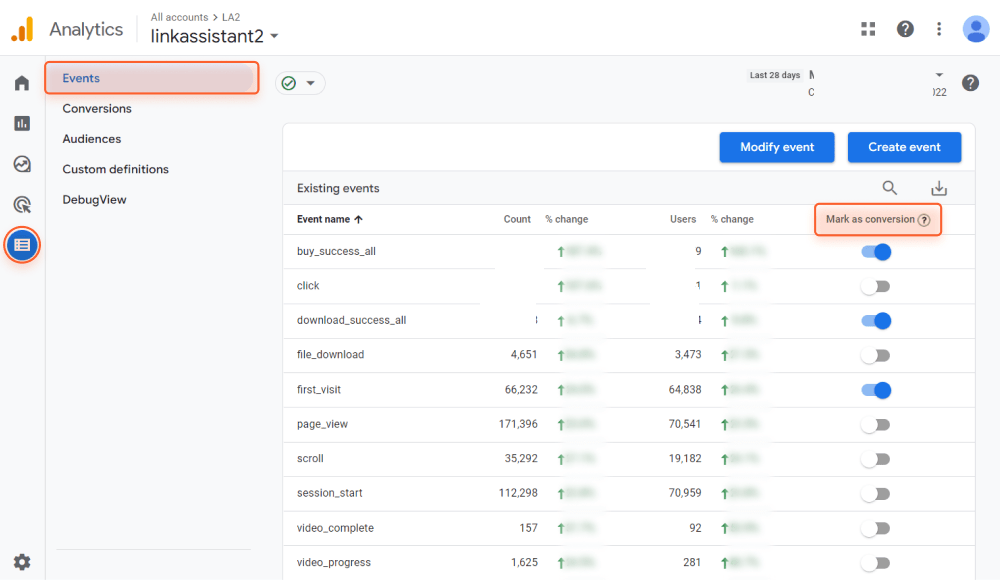
In GA4, conversions are event-based: you can turn on a toggle button to track an event as a conversion. Taking the flexibility that events have, you can measure conversions differently, using more parameters in a bunch.

Besides, you can set up an audience-triggered conversion: create an event with a condition, and when it’s accomplished, the analytics will start considering the event as a conversion.
There is a 30 conversion limit in the basic GA4, however, you can archive them to free up a new slot. This is handy, for example, for seasonal campaigns.
In Universal Analytics, you can use audience segmentation to do some marketing research. For example, you can compare segments of converters or bounced sessions to increase conversions or reduce customer churn. Simply add a new segment from the number of metrics you’re interested in and compare.
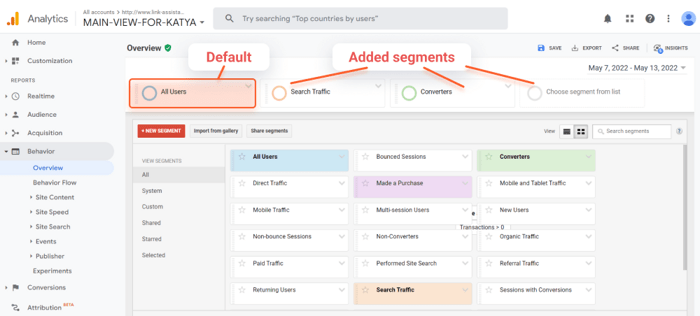

The segment comparison will be stored in the current view of Analytics as you go from one report to another across all sections.
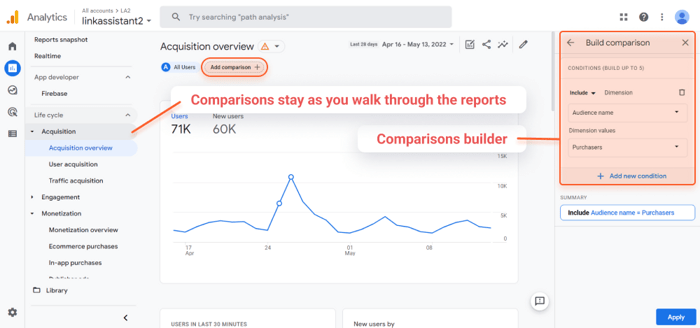
Technically, a similar way to compare audiences sliced and diced is available via the Comparisons feature in each report of Google Analytics 4. You press the Add comparison button and add the necessary dimensions from the comparison builder.

Besides the above, Google Analytics 4 has the Explore section where you can build segments and audiences. A very special feature here is that, in addition to user-scoped and session-scoped segments, GA4 allows doing more robust segmentation based on events. There are suggested templates, for example, Non-Purchasers, Demography, and Recently Active Users.
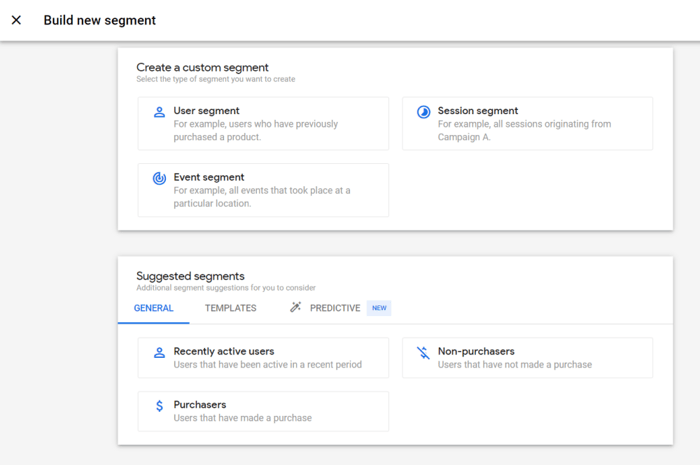
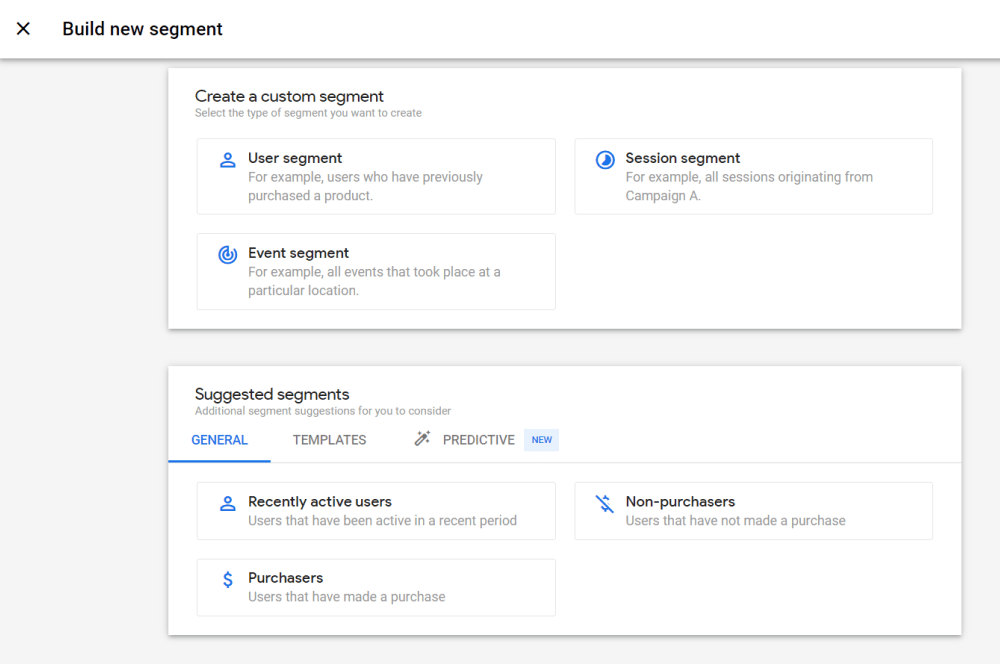
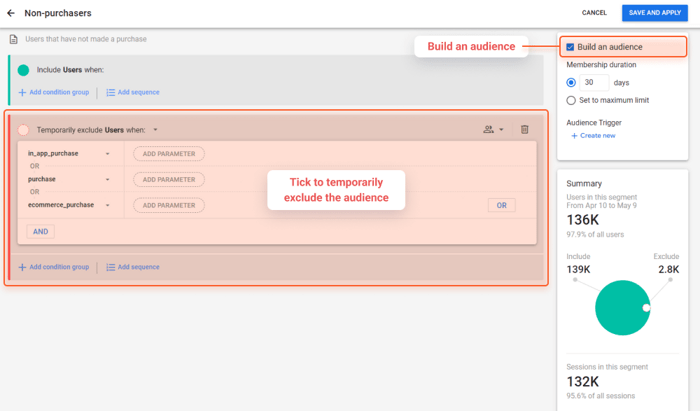
In GA4 you create segments and audiences with the help of the segment builder by adding the AND/OR conditions or regular expressions you need. A convenient feature, especially for remarketing purposes, is to temporarily exclude some audience groups.

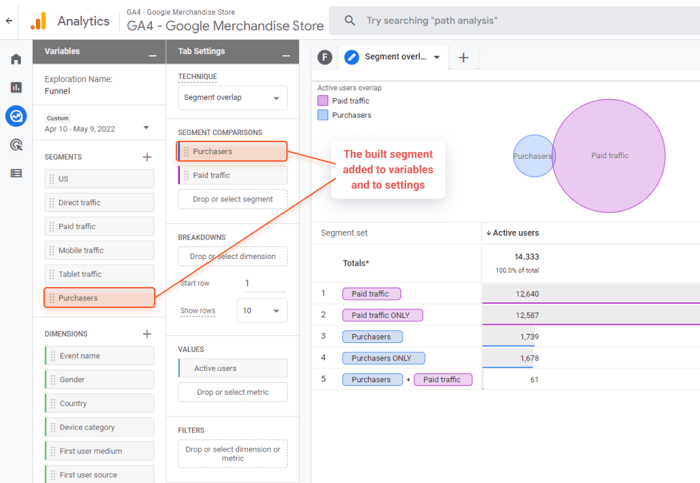
Save the segment, and it will be added to the Segments list in the Variable section of the constructor and the Segment Comparisons fields. Then you can add any other segment you want and compare them.

Alternatively, you can create a new audience from Configure > Audiences > New audience (the feature is available with the Editor role). You can download the audiences, duplicate, edit, or archive them. Note that there is a limit of 100 audiences per property.
You can share your audiences with other integrated tools, for example, Google Ads for advertising and remarketing. E.g., you can identify the users who added a product to the cart but did not buy anything and target them in your next remarketing campaign. Or you can use audiences for A/B testing with Google Optimize. You won’t need to share audiences one by one, they all will show up in the shared library.
Now with GA4, you can be better prepared for the future, with its new machine learning feature called predictive audience. For example, it can predict which of your visitors is likely to bring the most revenue within the next 7 days.
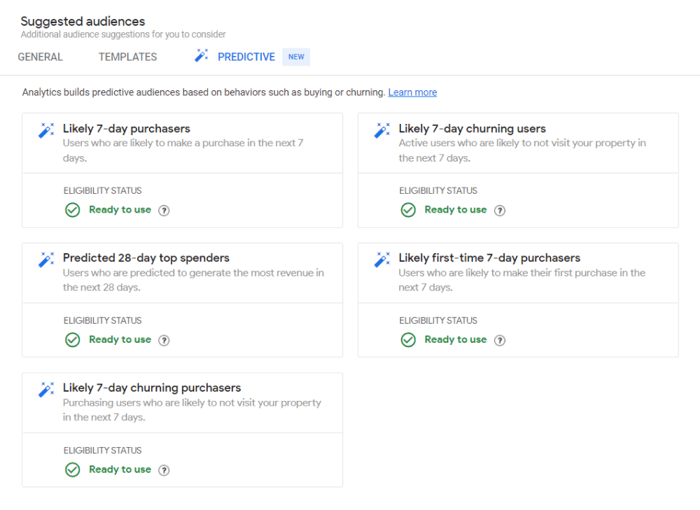
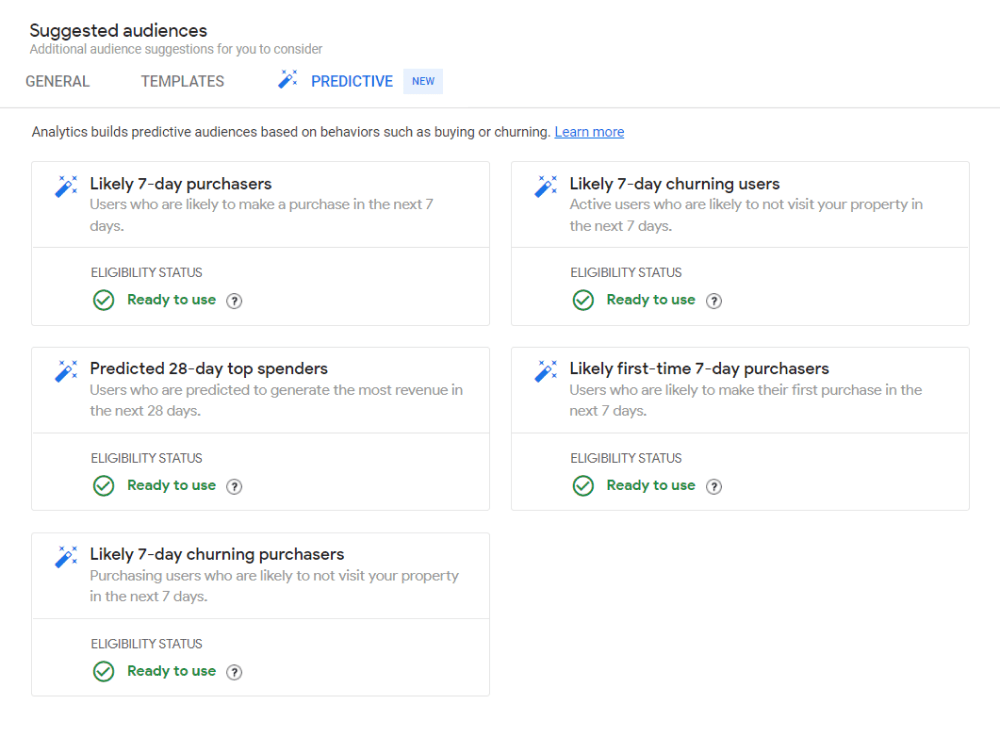
Predictive audiences appear once the data become eligible for estimations of predictive metrics, such as probable churn, probable purchase, and predicted revenue.
For the training model to be actionable, certain prerequisites have to be fulfilled: for example, at least 1,000 returning users hit the required condition, and the behavior is sustainable for a while.
The Explore section in GA4 offers the possibility to do an in-depth and more granular data analysis.
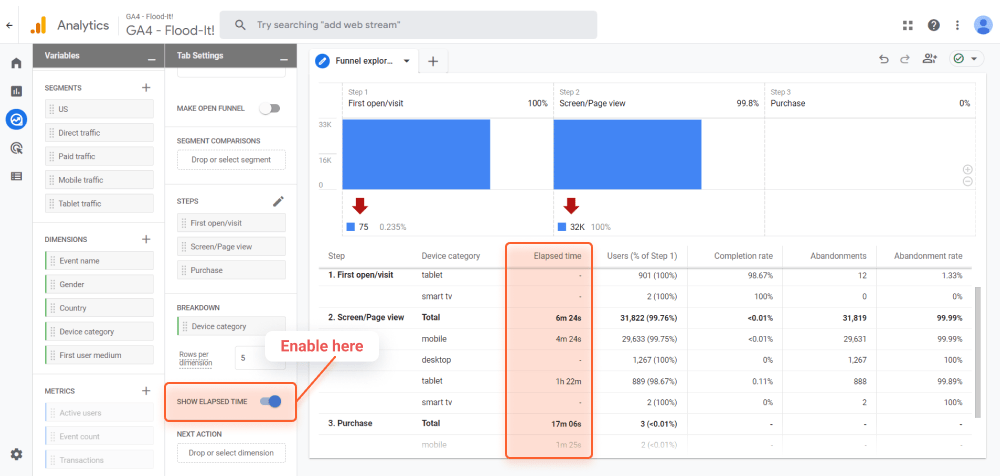
In GA4, the Funnel exploration report allows you to use the Show Elapsed Time at various funnel steps.
Let’s say, if you view a product in the morning, add it to the cart, then stop and come back to buy in the afternoon, reporting in UA will show abandonment in the morning session and conversion in the afternoon.
GA4 tracks all interactions and can calculate the elapsed time between any event, not just pageviews, i.e., how much time it took for a user to go from one step to another. In your Funnel explorations, simply add the steps and dimensions you need, and enable the corresponding toggle button to see the metric.

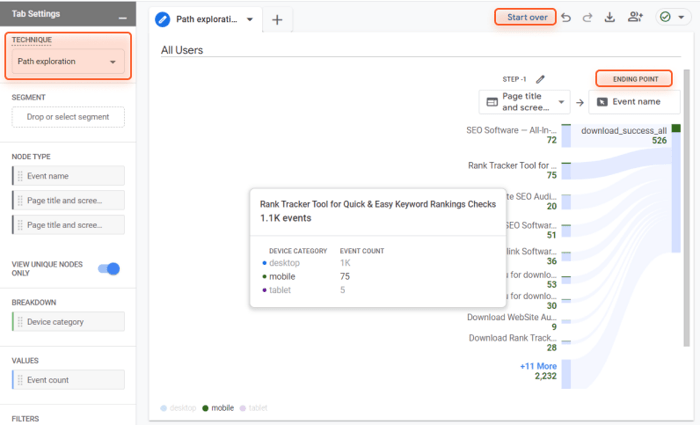
As for path explorations, they are similar to User flow or Behavior flow in Universal Analytics. However, a new interesting feature in GA4 is the possibility to build paths backward: you can select the ending event and find out how users got to it.
Go to Path explorations and hit Start over to create the path you want to explore. Select the Ending point and choose the type of node you need to check (for example, an event name, such as successful download).

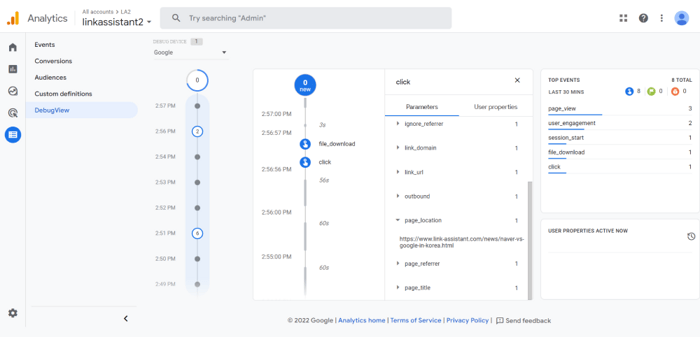
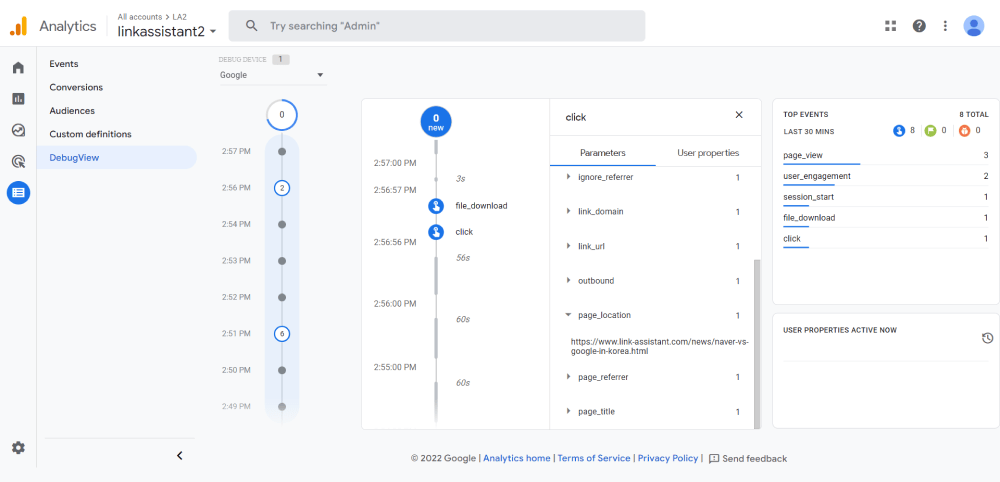
Debug View is a great addition in GA4 that makes real-time debugging much easier. You can see very granular data of what actions were triggered on your website and monitor all your implementations live.
To start using the debug tool, you will first need to enable the debug mode in your browser. There is a special Google Analytics Debugger Chrome extension that you need to install and enable. Then, proceed to Configure > DebugView, and interact with your website from the device on which the debug mode is enabled. In the Debug View, you will observe the events triggered by your actions.
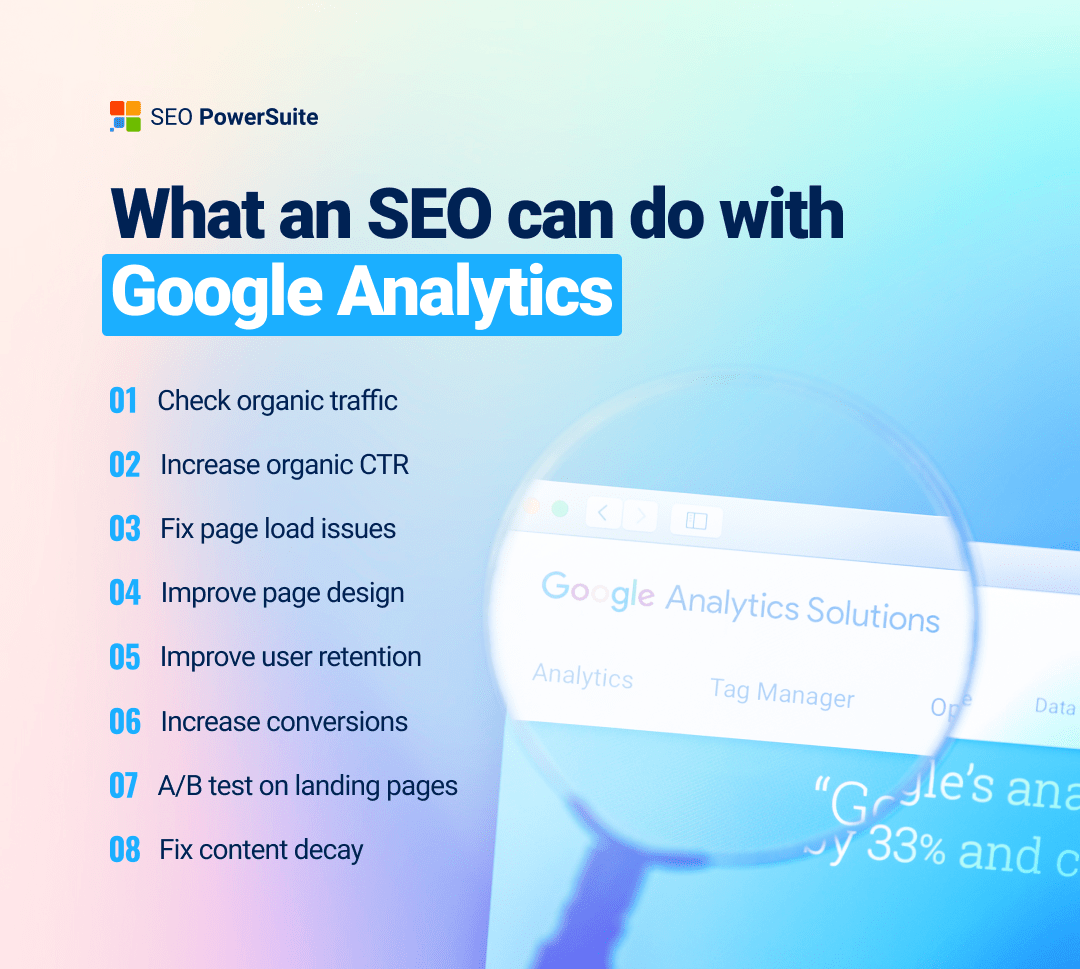
Google Analytics is one of the most popular tools for SEO because it has so many stats to show about your content and the website performance in general.

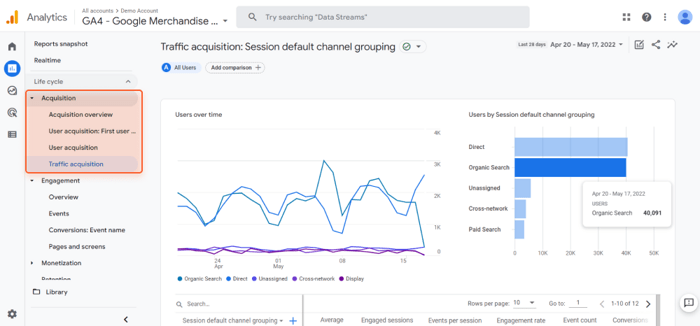
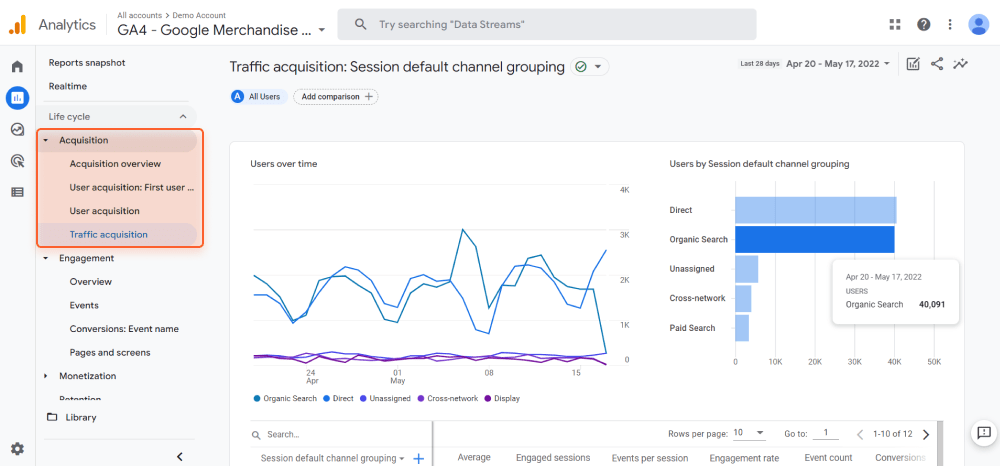
First and foremost, Google Analytics lets us determine the main organic traffic sources. To have an overview of your organic traffic share, go to Acquisition > Traffic acquisition.
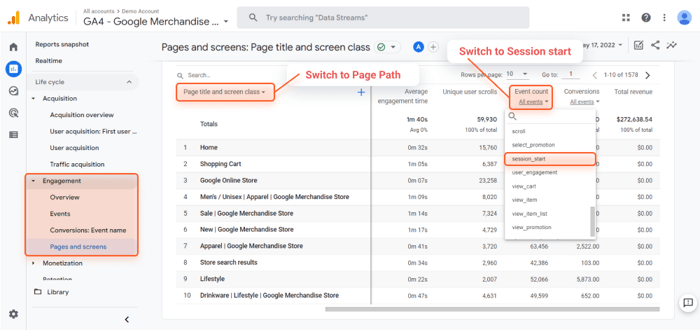
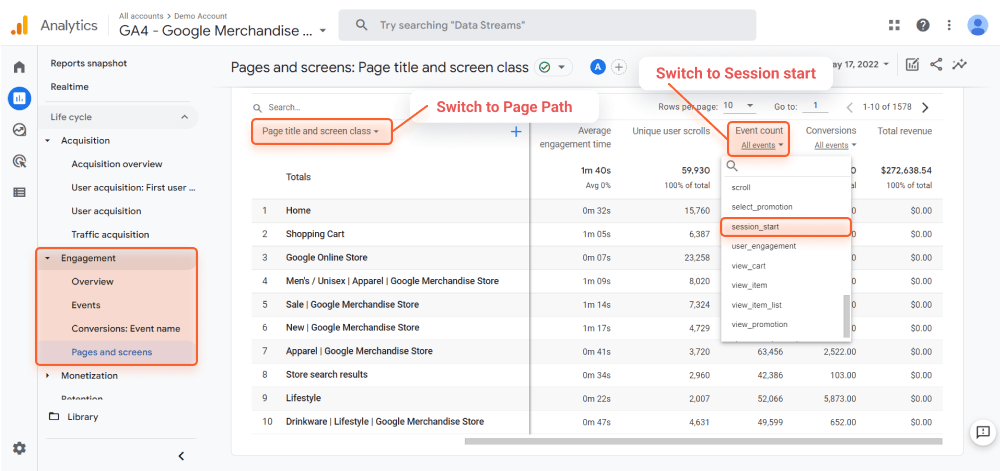
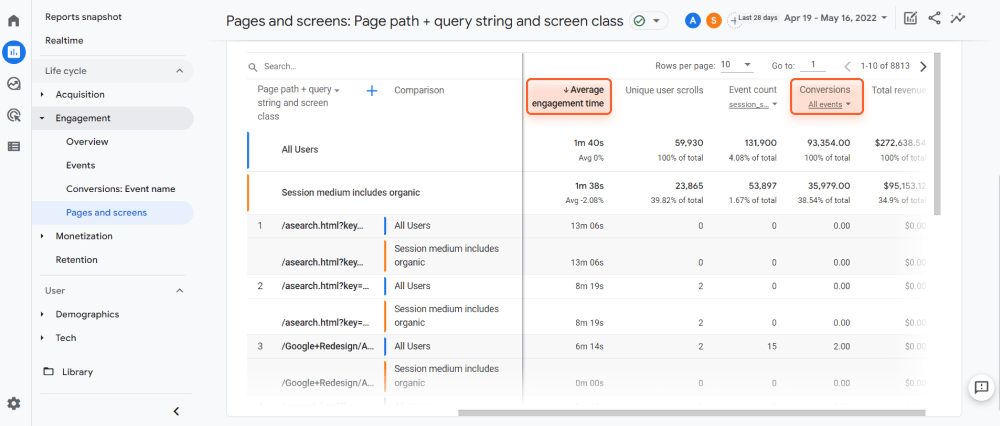
To have a detailed view of your best-performing landing pages, go to Engagement > Pages and Screens. Here, you will see all your users that interacted with your pages. So, you need to filter only session_start in the Events dropdown menu.
A nice tip here is to change the dimension of Page Title to Page Path, as the URL changes less frequently than the title.
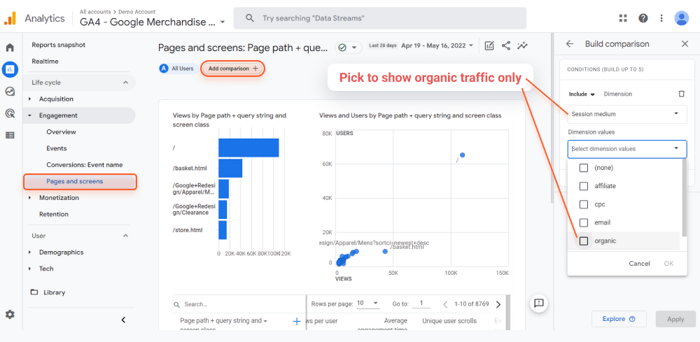
Then add a comparison and include the Session medium > Organic dimension. That will show you a filtered view of organic traffic by landing pages’ URLs.

Next, you probably would like to examine the performance of your organic landing pages. In Universal Analytics, we can analyze the bounce rate metric (depending on the needs of a project, of course). By filtering out the pages with a high bounce rate, we look for what to improve on them.
In Google Analytics 4, the bounce rate was replaced by engaged sessions. An engaged session happens when the given session:
An engaged session is an inverse metric to bounce rate that measures action rather than the lack of it. Besides, the engaged session solves the problem of session timeout.
In Universal Analytics, you can modify the session timeout condition from 1 minute to 4 hours.
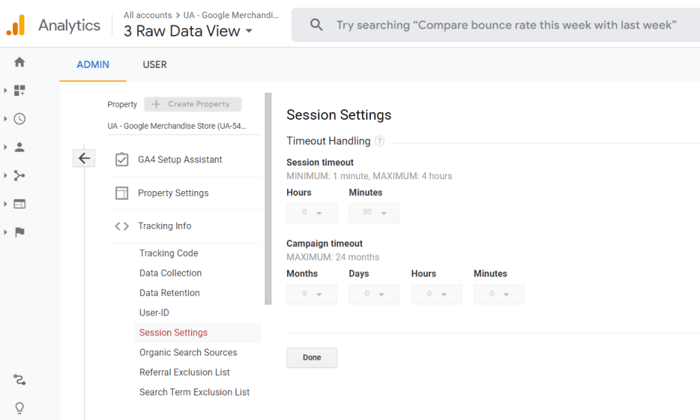

Bounce rate only indicates there is a problem on a page but requires further investigation. The reason could be site speed, broken links, or simply the page was not aimed at any long interaction.
User engagement provides more informative insights into how users behave on a page.

Then, we can compare landing pages by conversion. Of course, we want to find our top gainers. But more important is to find and improve those pages that underperform.
Search Console lets you find your top pages that get the most impressions and clicks from search. By linking Search Console to your GA4, you can look up your top queries and URLs by:
You’ll get a visualization of all your landing pages and queries. Further below, you can look through all your data by rows.

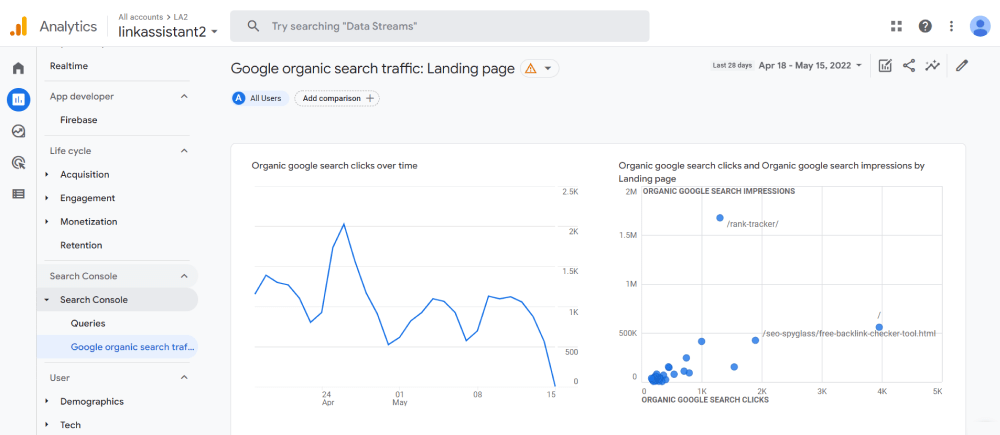
First, this helps you spot the best-ranking pages and make them your top conversion pages. Second, you can find your underperforming pages and improve their organic click-through rate. These low-hanging fruits will help you generate organic traffic with less effort.
Finally, you can track your progress over time and plan content. It is crucial to draw an evaluation plan, otherwise, you risk losing the purpose of tracking the events you implemented.
Google Analytics provides website owners with much information crucial to effective marketing. Looking into Google Analytics, you will be able to plan resources more efficiently, for example, by reviewing and recycling old content.
Here is our guide on the main SEO metrics that website owners should track as part of a broader digital marketing strategy. These SEO KPIs will let you assess the efficiency of your SEO strategy and pinpoint errors and growth opportunities.
Alas, for newcomers, the platform may look extremely complex and confusing. Actually, that is why many site owners get advice from market experts and digital analysts, someone who understands Google Analytics.
To check the proficiency in Universal Analytics, there is a certification exam known as the Google Analytics Individual Qualification test (GAIQ).
For testing the knowledge of Google Analytics 4, there is an Analytics IQ exam at Skillshop, Google’s learning platform.
The exam is free, and before sitting it, Google suggests taking Academy Courses at the Analytics Training and Support center. The courses are free and vary for Google Analytics beginners or advanced users.
This can be a great proof of proficiency and help you build your career path in SEO, online marketing, business analysis, and tons more. However, the document only serves as an individual validation of your knowledge of the subject.
So, I hope this article has sorted out some basic things about Google Analytics 4 and inspired you to test it sooner. Probably, you have your own way of using Google Analytics for SEO and your own use cases. Your feedback is welcome! Join our Facebook user group and follow SEO PowerSuite on Twitter.
| Linking websites | N/A |
| Backlinks | N/A |
| InLink Rank | N/A |