
Website Structure
Visualization Tool
in Website Auditor
Check out the visual way to spot issues in your site architecture, analyze internal link structure, and explain errors to SEO clients.
What does your site structure look like to search engines? Is your website prone to serious leaks of
crawl budget and link juice? Are your important pages linked well?
The interactive SEO tool for website structure visualization will give you instant answers to these
questions. Enjoy our exquisite visual sitemaps: graphical maps of your website that are both stunningly
good-looking and actionable!
If you don't have WebSite Auditor yet, download
it here.
Launch the website crawler and paste the URL to create a project for your website. Next, jump straight
to the Visualization dashboard for your visual site audit.
1
Instantly uncover problems
in your site structure.
A visual sitemap lets you instantly view your website structure, link hierarchy and prominence of
separate pages. You'll be able to identify orphan pages (shown in grey), isolated parts of your site
(chains of successive nodes), redirects (shown in blue), broken links (shown in red), explore click
depth, navigation problems in your site's architecture — all the hyperlink structure at a glance.
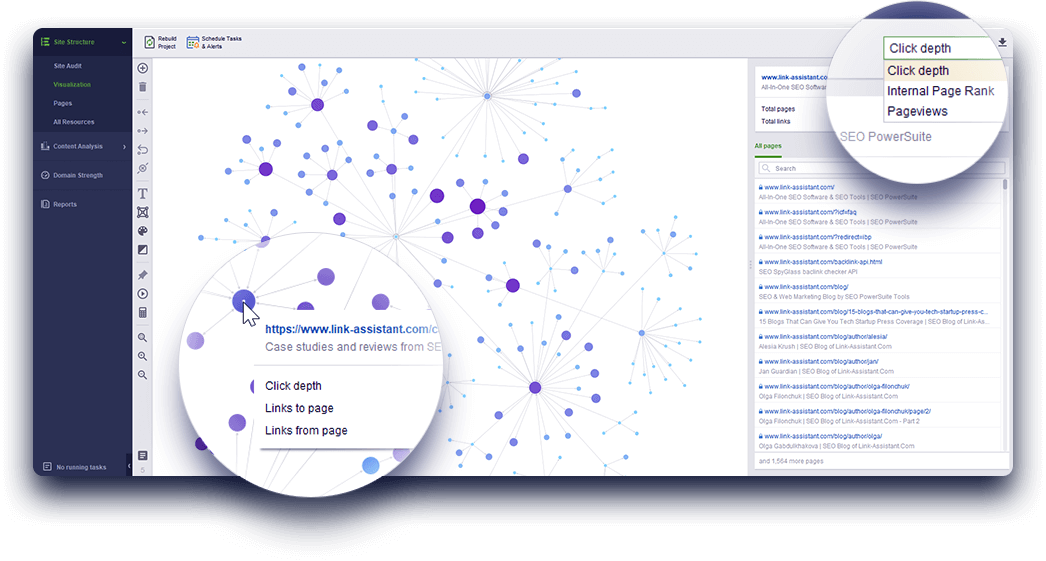
2
Measure & improve
internal PageRank.
You can choose to visualize your website structure by PageRank and see how internal link juice is
distributed across your pages. From the dropdown menu in the top right, switch to Internal PageRank
view. The analysis tool will visualize the graph in different colors, showing the ranking potential
flow to your most important pages.
3
Generate a graph to visualize the structure
by Pageviews.
Visualize your site structure by pageviews to find out which pages are the most popular with your
website visitors. Sync your Google Analytics account with WebSite Auditor and update the Page
Traffic stats. Your web pages on the graph will be painted and sized accordingly, with
information about views each page gets.
4
Creative tool to visualize
and interact.
The tool lets you interact with every object on the visual map and visualize the structure to your
liking and convenience. Hit the Auto-arrange pages button in the left-hand menu to visualize
the
structure in a neat and understandable graph. Switch between pages on the right to highlight them on the
graph, or drag-n-drop nodes to rearrange them! You can pin the selected nodes to stay in place on the
map. Enable color-coded values for different types of web pages. Change the background for your
visualization in the left-hand menu. And zoom in and out, of course.
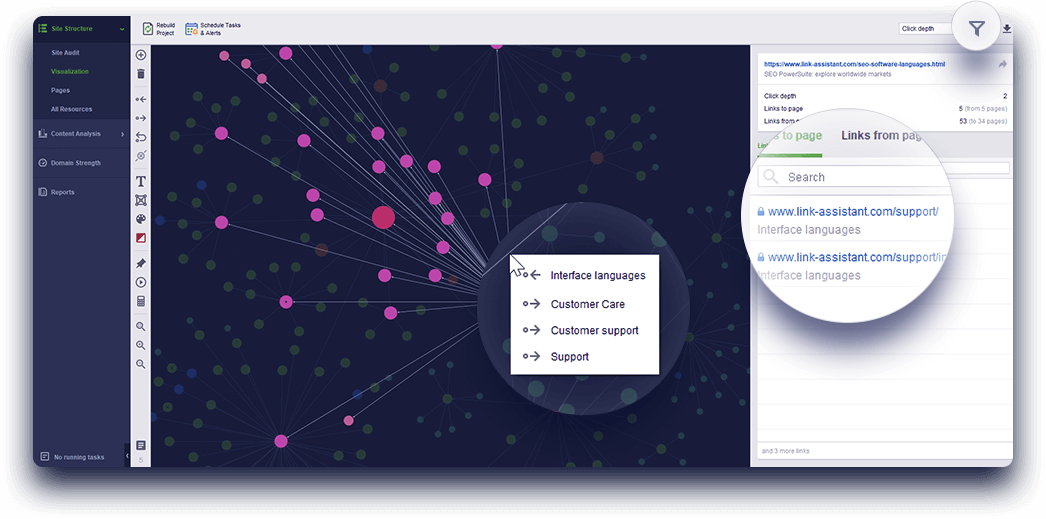
5
Examine pages
in-depth.
Looking for information on a specific page for in-depth analysis? Click on any node in your visual
sitemap to highlight all the page's relations and values. You will get a full list of links to and
from the page in the right-hand view, and the estimates of PageRank, Pageviews or click depth of the
given page in your website structure.
6
Filter out,
filter in.
How about some filtering while you are editing your visual sitemap? Use filters to build separate
visual sitemaps for specific pages and different directories, or adjust the number of pages your
visual sitemap includes. Use tags and labels to manage your link structure and pages conveniently.
And leave notes with additional information for your SEO team.
7
Edit in-app to create a
healthy hyperlink structure.
Edit your website structure by adding or removing links so you can improve internal linking,
PageRank flow and navigation for website visitors, get rid of broken links and unnecessary
redirects, and so on — until your graph is clean and perfectly structured. Add new pages or
remove
the existing ones, add incoming and outgoing links, and hit the Recalculate PageRank button: the
analysis tool will structure automatically all the new links and pages and update PageRank
values.
8
Export your list of changes and send it straight to development.
Every change you make as you edit the graph will be recorded in the changelist. When you're done
editing your link structure and pages, simply export the information in a CSV spreadsheet.
Forward
the list to your SEO team so they can take the changes live, and make your perfect site
architecture
a reality.
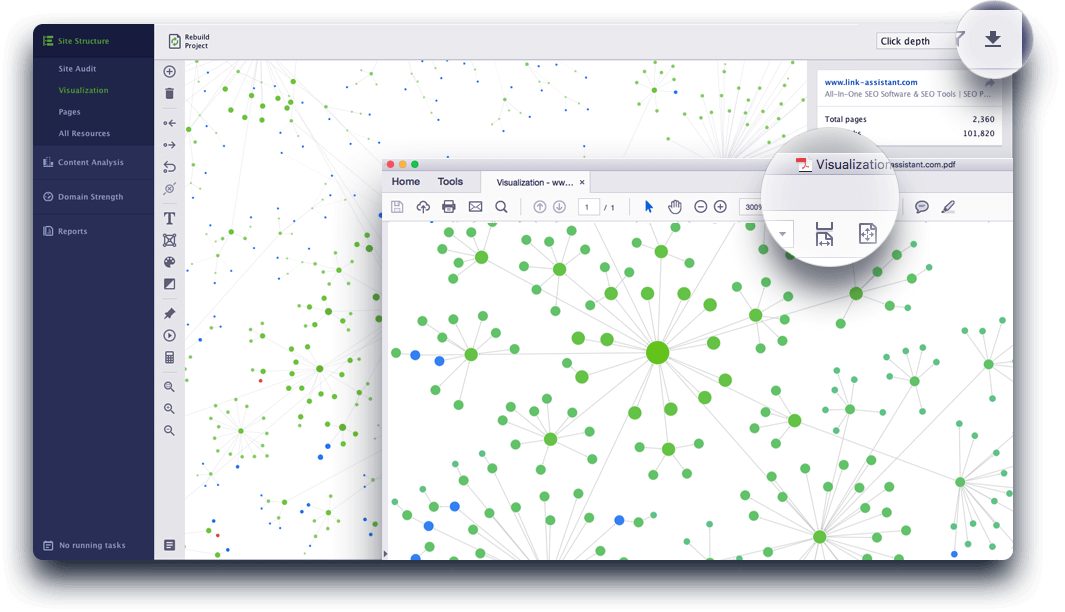
9
Delight clients with easy-to-grasp
visual sitemap.
If you ever sent clients spreadsheet reports to show problems in their website structure, you know exactly how unconvincing those are. Don't overload your clients with tons of technical information, instead show them intuitive site visualizations that highlight these problems graphically.
Believe us: when you see your website visual map, you'll want to share it with the world. And you can do it — whether you have a Professional or Enterprise license, you can easily download your visual sitemap in PDF, PNG, or SVG by hitting the save button in the top right corner.